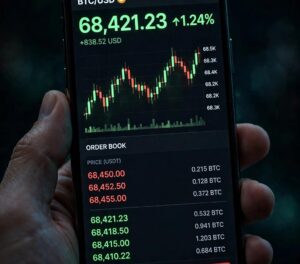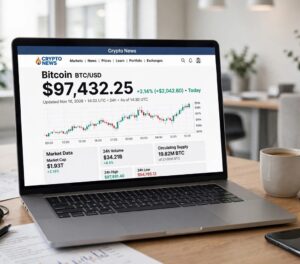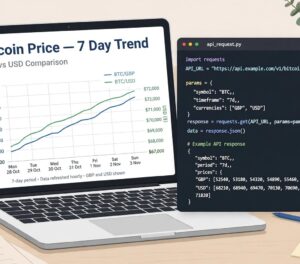


Ali opened the CoinDesk price page on the evening of 9 November 2026 and saw a number that did not match his exchange app. One screen said about $75,400. The other said about $74,600. He had not made a mistake. He had found the first lesson of this guide: there is no single bitcoin btc usd current price coindesk quote that every platform shares to the cent. Each source measures the same market in a slightly different way. This article explains how to read the CoinDesk page properly, what its index really is, and how to use it without being fooled by a single flashing number.
Price at time of writing — read this first: BTC was about $74,830 on Tuesday 10 November 2026 at 10:24 PKT (05:24 UTC, Finnhub, Binance BTC/USDT), with the day so far ranging $73,750 to $75,568 and a change of about +0.3% against the previous close; Monday 9 November closed at $74,900 after a $73,510 low. The 200-day moving average sat near $73,150. The US CPI report lands on Tuesday evening at 18:30 PKT and prices move fast around it, so refresh the page for the live figure. Nothing in this article is a price prediction.
If you want the longer story behind today’s level, start with our Bitcoin price history 2025–2026 guide. If you want the mechanics of how any live quote is built, read our companion piece on the Bitcoin BTC/USD live price. This guide stays on one page: CoinDesk.
Executive Summary
- CoinDesk shows a reference price, not an exchange order book. Its headline number comes from the CoinDesk Bitcoin Price Index (XBX), which blends prices from several large exchanges.
- The price updates constantly, but it is a snapshot of an index. It moves as the underlying exchange prices move, and it can differ from any single exchange by tens or even hundreds of dollars.
- The page is more than a number. It shows a chart, market cap, 24-hour volume, the 24-hour range, and often the day’s news that moved the market.
- On 9 November 2026 Bitcoin traded between $73,510 and about $76,100. It fell to its lowest level since August late on Sunday, then bounced back above $75,000.
- Use CoinDesk for context, and an exchange for execution. Check the index before you trade, then check the actual price on the venue where you will buy or sell.
- The US CPI report lands on Tuesday 10 November at 18:30 PKT. Expect sharp moves around that release, and do not treat a pre-CPI price as a forecast.
What the CoinDesk Bitcoin Price Page Actually Shows
The CoinDesk price page looks simple. A big number sits at the top. A chart runs underneath. A few smaller figures sit beside it. Each of those pieces answers a different question, and most new readers only look at the big one. That is the first mistake. The page gives you a full picture only when you read all of it together.
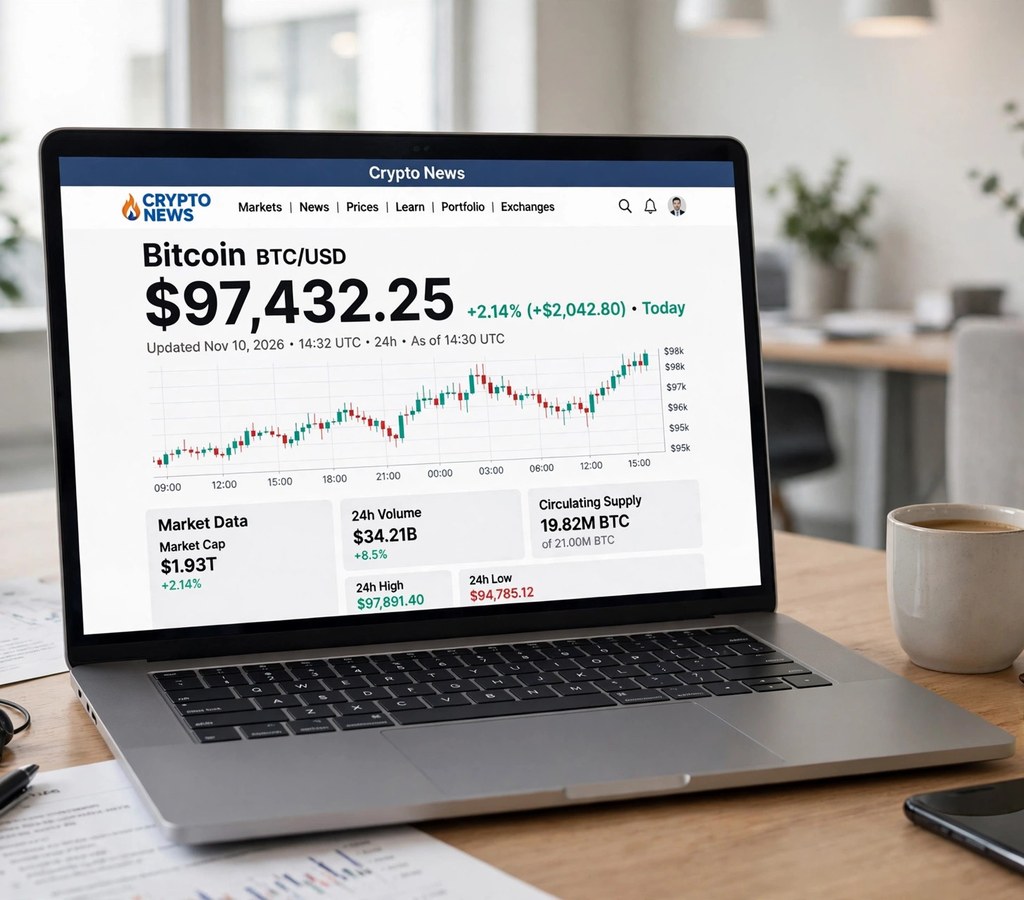
The headline figure is the bitcoin btc usd current price coindesk quote most people search for. It is a US dollar price for one Bitcoin. It is not the price of the last trade on one exchange. It is the current value of the CoinDesk Bitcoin Price Index (XBX). The index takes prices from a set of leading exchanges, weights them, and produces one reference rate. When the exchanges disagree, the index sits somewhere in the middle.
Beside the price you will usually see the 24-hour change, shown as a percentage and as a dollar amount. A fall of 1% sounds small. On a $75,000 asset it is $750. Always read the dollar figure as well as the percentage. Below that, the page shows market capitalisation, 24-hour trading volume, and the 24-hour high and low. Together they tell you whether a move is broad and well supported, or thin and easy to reverse.
The Fields on the Page, Explained in Plain Words
| Field | What it means | How to use it |
|---|---|---|
| Current price | The XBX reference rate in USD right now | Use it as a benchmark, not as an order price |
| 24h change | How much the price moved in the last 24 hours | Read the dollar amount too, not just the percentage |
| Market cap | Price multiplied by coins in circulation, about $1.5 trillion in November 2026 | Shows Bitcoin’s size against other assets |
| 24h volume | How much Bitcoin changed hands in a day | High volume supports a move; low volume warns it may fade |
| 24h high and low | The highest and lowest prices in the last day | Shows the real range, not just the current point |
| Chart | Price history over your chosen time frame | Switch time frames before you judge a trend |
Our blockchain explorer guide shows how to check on-chain facts behind a price move, and our Bitcoin price history API guide explains where the raw price data in articles like this one comes from.
What Is the CoinDesk Bitcoin Price Index (XBX)?
The CoinDesk Bitcoin Price Index, known as XBX, is the engine behind the page. CoinDesk Indices runs it, and it has a long track record in the industry. It serves as a benchmark for products holding more than $21 billion in assets under management, according to the parent company’s own filings. That matters because it means real money, not just website readers, depends on this number being fair.
An index solves a real problem. Bitcoin trades on hundreds of venues at once. At any second, Binance might print $75,100 while Coinbase prints $75,250 and Kraken prints $75,180. None of them is wrong. Each one is the price of the last trade on that venue. A reader who wants “the price of Bitcoin” needs one number that represents the whole market. The index builds that number by combining the venues it trusts, with rules for weighting them and for dropping a venue whose data looks broken.
Why an Index Beats a Single Exchange Quote
A single exchange can mislead you. Its price can jump on a large order, a thin order book, or a brief outage. An index smooths those jumps out. It also protects you from the opposite error: trusting one venue that has drifted away from the rest of the market. If one exchange halts withdrawals, its price can trade at a premium or a discount for hours. The index keeps you anchored to the broader market.
That does not make the index perfect. It is still a calculation, and its result depends on which exchanges it includes and how it weights them. CoinDesk Indices publishes its method, and serious users should read it before relying on the number for anything important. For everyday reading, the key point is simple: the bitcoin btc usd current price coindesk figure is a blended reference rate, and a small gap between it and your exchange is normal.
How the Price Updates — and How Fast It Really Is
The page updates through the trading day, and the number you see is close to live. But “close to live” is not the same as “the price you will get”. Three delays sit between the index and your trade. First, the exchanges report their trades. Second, the index recalculates. Third, your browser refreshes. In a calm market those delays are a second or two and nobody notices. In a fast market they matter.
On the night of 8–9 November 2026, Bitcoin fell from just above $75,600 to about $73,761 within an hour, then bounced back above $75,000. A reader who refreshed the page during that hour saw the number move by hundreds of dollars between refreshes. That is normal in a whipsaw. The lesson is not to distrust the page. It is to never place a market order based on a number you saw a minute ago. Check the live quote on your own exchange at the moment you trade.
How to Read the Chart Without Fooling Yourself
The chart is the most misread part of the page. Most readers leave it on the default time frame and draw a conclusion from one slope. Change the time frame first. A chart that looks like a crash on the one-hour view can look like a small dip on the one-month view. Both views are true. They answer different questions.
Start with the daily chart for direction, then drop to the hourly chart for timing. Look at volume under the price. A sharp fall on heavy volume means many sellers acted at once. The same fall on thin volume may mean only a few large orders moved a quiet market. On 9 November, CoinDesk data put Bitcoin between its 200-day moving average near $73,150 and its 100-day average near $77,430. Those two lines framed the whole day: support below, resistance above, and a price stuck in between.
Three Chart Habits That Save Beginners Money
First, always note the date and time of the chart you are reading. A screenshot from the morning can be badly out of date by the evening. Second, compare the price with the 24-hour range, not with yesterday’s price alone. A coin that is down 1% on the day may still sit near its daily high. Third, never trade on a chart pattern alone. Patterns describe the past. They do not promise the future, and in a market driven by news, as November 2026 has been, a headline can break any pattern in minutes.
CoinDesk vs Other Price Sources: What Changes and What Does Not
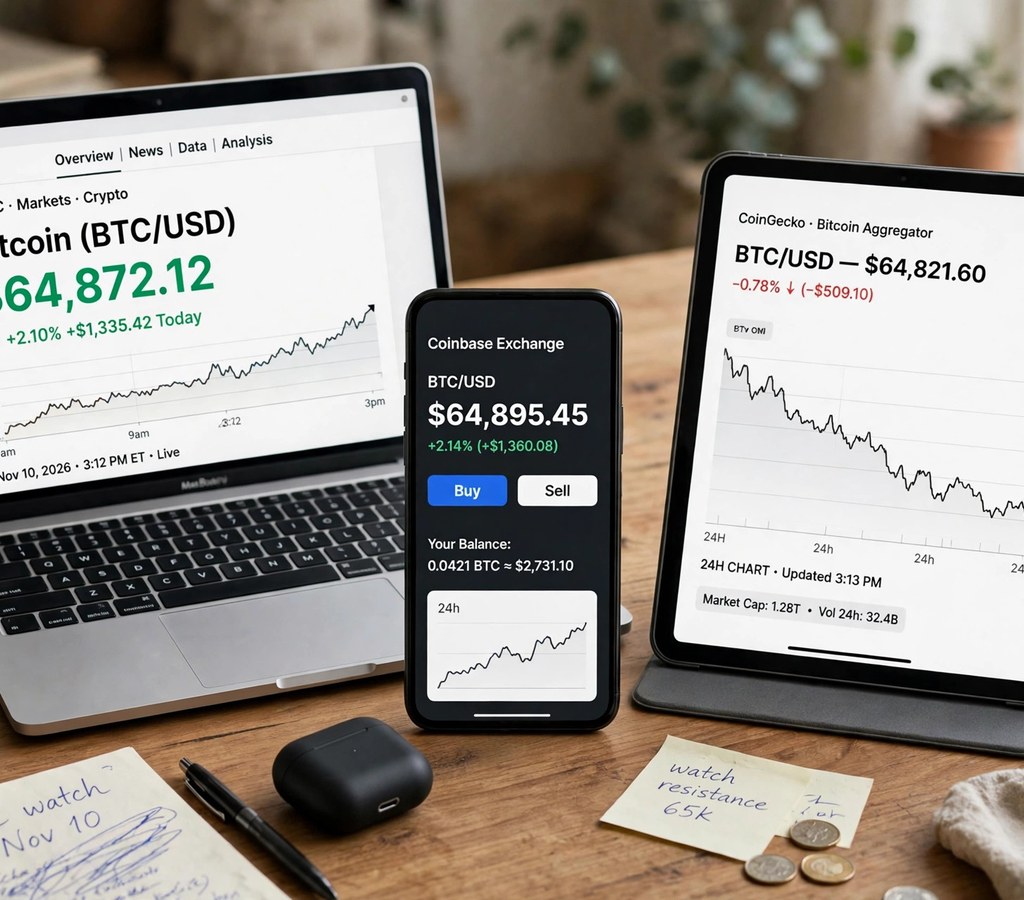
Readers often ask why CoinDesk, CoinGecko and CoinMarketCap show different prices at the same moment. The answer is that they measure different things. CoinDesk shows its own index. CoinGecko and CoinMarketCap show volume-weighted averages across many more venues, including smaller ones. An exchange shows its own last trade. All three can be right at once.
| Source | What its price is | Best use | Watch out for |
|---|---|---|---|
| CoinDesk / XBX | Index of leading exchanges | A trusted benchmark and news context | May differ from your exchange by $100 or more |
| CoinGecko | Average across many exchanges | Comparing coins and checking market breadth | Includes smaller venues with thinner books |
| CoinMarketCap | Average across many exchanges | Rankings, market cap and dominance | Volume figures can include wash trading |
| Binance / Coinbase | Last trade on that venue | The price you will actually get | Can spike on one venue alone |
| TradingView | Charting across many feeds | Technical analysis and alerts | You must pick the feed yourself |
The practical rule is to pick one benchmark and one execution venue, and to know which is which. Use CoinDesk to answer “what is Bitcoin doing today?” Use your exchange to answer “what will I pay right now?” Mixing the two up is how people blame a price page for a fill they did not expect.
Step by Step: Reading the CoinDesk Price Page in Two Minutes
Follow this routine each time you open the page. It takes two minutes, and it stops most beginner errors.
Step 1: Read the price and the 24-hour range together
Note the current price, then the 24-hour high and low. On 9 November the range ran from $73,510 to about $76,100. A price near $75,400 sits in the upper half of that range, not at the top. That tells you the bounce held, but the day’s high is still above you.
Step 2: Check volume and market cap
High volume on a down day means real selling. Low volume on a bounce means the recovery is fragile. Market cap near $1.5 trillion tells you the scale: a 1% move is about $15 billion of value, which is why even small percentages feel large.
Step 3: Read the news beside the price
CoinDesk pairs its price page with its newsroom. On 9 November the news was not about crypto alone. Reports of an investigation touching the Nvidia chief executive and stalled US–Iran talks rattled risk markets, and Bitcoin fell with them. The Nasdaq had already fallen nearly 5% the previous week. Price without news is just a number. Price with news is a story you can test.
Step 4: Switch the chart to a longer time frame
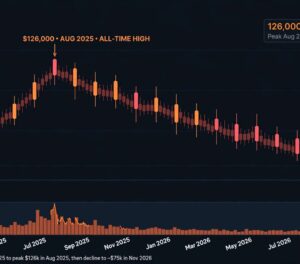
Look at one week, then one month, then one year. In November 2026 the one-year view shows a coin down about 29% over twelve months and about 15.8% year to date, after a 2025 high above $126,000. The one-day view shows a bounce. Only the longer view shows which of those two stories is bigger.
Step 5: Compare with one other source before acting
Open CoinGecko or your exchange and compare. A gap of a few dozen dollars is normal. A gap of several hundred dollars means something is happening on one venue — check the news before you trade.
Case Studies: Four Days When the CoinDesk Price Told the Story
Case Study 1: The Sunday-night whipsaw, 8–9 November 2026
Problem: Bitcoin fell from above $75,600 to about $73,761 late on Sunday, its lowest since August, then recovered above $75,000 within hours. Leveraged traders were caught on both sides. Strategy: readers who checked the CoinDesk page saw the 24-hour range widen fast and the news feed explain why — macro headlines, not a crypto-specific failure. Execution: patient holders who read the range instead of the flashing price did nothing. Results: more than $1 billion in leveraged positions were liquidated in 24 hours, with Bitcoin accounting for about $272 million of it, according to CoinGlass figures cited by CoinDesk. Lesson: a whipsaw punishes leverage, not patience.
Case Study 2: The $80,000 reclaim that lasted a day
Problem: after the US midterm elections, Bitcoin jumped above $80,000, and many readers treated the level as a new floor. Strategy: the CoinDesk chart on a longer time frame showed the move as a sharp spike inside a downtrend, not a trend change. Execution: traders who waited for a daily close above $80,000 stayed out. Results: the price fell back below $75,600 within two days, and by 9 November it was testing $73,510. Lesson: one day above a round number is a headline, not a breakout. Our midterms history article covers the longer pattern behind that move.
Case Study 3: Red October and the weakest October since 2014
Problem: October 2026 closed in the red, the weakest October for Bitcoin since 2014, and demand went negative according to CryptoQuant. Strategy: readers who followed the CoinDesk price page through the month saw a slow grind lower, not one crash. Execution: they could see volume fading and ETF flows turning negative week by week. Results: the month set up the November slide instead of surprising holders with it. Lesson: a monthly chart tells you what a daily chart hides. Our Red October article walks through that month in full.
Case Study 4: Strategy keeps buying near its own cost basis
Problem: while the price fell, Michael Saylor’s Strategy bought 1,036 more bitcoin in a week for $81.9 million, an average of $79,012 each. Strategy: the company’s overall average purchase price is about $75,456 — almost exactly where Bitcoin traded on 9 November. Execution: the purchase was disclosed publicly, and CoinDesk reported it beside the price. Results: the stock and the coin both fell anyway, because one buyer cannot hold up a whole market. Lesson: even a famous buyer is one data point. Read it with the ETF flows, which showed $1.28 billion in weekly net outflows from US spot Bitcoin ETFs, flipping 2026 year-to-date flows negative.
Common Mistakes on the CoinDesk Price Page
The most common mistake is treating the index price as a tradable price. You cannot buy Bitcoin at the XBX rate. You buy it on an exchange, at that exchange’s price, plus its fee and spread. The second mistake is reading the price in isolation. A price of $75,000 means little without the range, the volume, and the news. The third mistake is refreshing the page during a panic and trading on the worst print of the day. The fourth is trusting a screenshot. Prices in November 2026 have moved $2,000 in an hour. A screenshot from the morning is history by the evening.
Another quiet mistake is ignoring the currency. The bitcoin btc usd current price coindesk quote is in US dollars. Readers in Pakistan, the UK or Europe who convert it in their heads often use a stale exchange rate and then wonder why their local price looks wrong. Use the page’s own currency switcher, or convert with a live rate, and remember that local exchanges add their own premium or discount on top.
Tools and Resources: 12 Ways to Check the Bitcoin Price
1. CoinDesk
Pros: trusted index, strong newsroom beside the price, long track record. Cons: the index price is not a tradable price. Pricing: free to read the price page. Best for: a benchmark quote with context.
2. CoinDesk Indices / XBX
Pros: the method behind the price, used as a benchmark for billions in products. Cons: technical documents, not a casual read. Pricing: index data free to view; licensed use for products. Best for: understanding what the headline number really is.
3. CoinGecko
Pros: broad coverage, free, good historical data. Cons: averages include smaller venues. Pricing: free; paid API plans for heavy use. Best for: comparing coins and checking market breadth.
4. CoinMarketCap
Pros: rankings, dominance and market cap in one place. Cons: volume data needs care. Pricing: free; paid API plans. Best for: market structure at a glance.
5. TradingView
Pros: the best free charting, alerts, many feeds. Cons: you must choose the feed, or you will compare unlike prices. Pricing: free tier; paid plans for more alerts and indicators. Best for: technical analysis.
6. Kaiko
Pros: institutional-grade market data, clean exchange coverage. Cons: built for professionals, not casual readers. Pricing: paid, with limited free data. Best for: verifying data quality.
7. CCData (CryptoCompare)
Pros: exchange rankings and benchmarks, strong research. Cons: some data sits behind paid tiers. Pricing: free basics; paid data plans. Best for: judging which exchanges to trust.
8. Binance
Pros: deepest liquidity, the price you can actually trade. Cons: its own price can spike alone. Pricing: free to view; trading fees apply. Best for: execution and live order-book depth.
9. Coinbase
Pros: clean interface, regulated US venue, good for beginners. Cons: fees are higher than on some rivals. Pricing: free to view; trading fees apply. Best for: a first check on a trusted US venue.
10. Kraken
Pros: strong security record, good charting, reliable data. Cons: fewer coins than the largest rivals. Pricing: free to view; trading fees apply. Best for: a second venue to cross-check a price.
11. Bloomberg Crypto
Pros: professional terminal-grade coverage, macro context. Cons: expensive, built for institutions. Pricing: paid terminal and subscriptions. Best for: linking crypto moves to stocks, rates and CPI.
12. Yahoo Finance
Pros: free, familiar, shows Bitcoin beside stocks and gold. Cons: crypto data is less deep than on specialist sites. Pricing: free; paid premium tier. Best for: a quick check inside a wider portfolio view.
| Tool | Price type | Cost to read | Best for |
|---|---|---|---|
| CoinDesk / XBX | Index | Free | Benchmark + news |
| CoinGecko | Multi-exchange average | Free | Comparisons |
| CoinMarketCap | Multi-exchange average | Free | Rankings |
| Binance | Exchange last trade | Free to view | Execution |
| TradingView | Your chosen feed | Free tier | Charts and alerts |
What the CPI Release on Tuesday Means for the Price Page
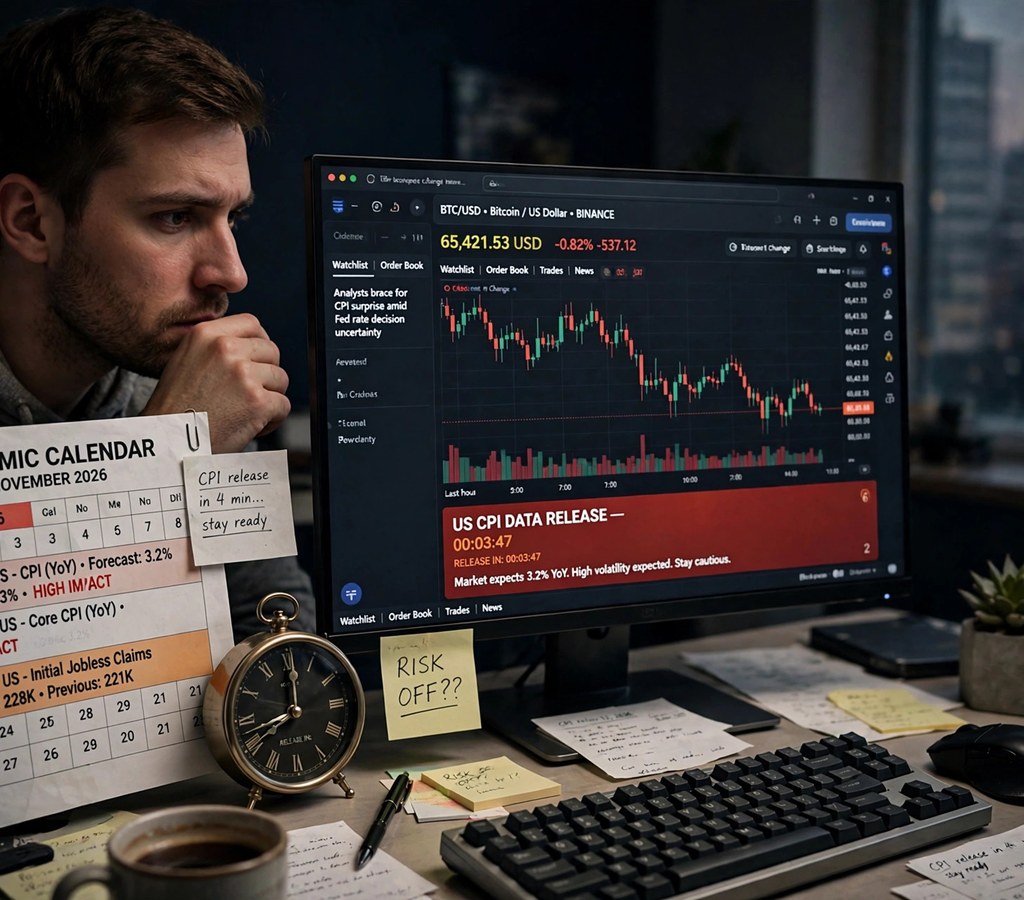
The US CPI report for October 2026 lands on Tuesday 10 November at 8:30 a.m. ET, which is 18:30 PKT. The previous reading was 3.7% year on year, with core inflation at 2.6%. Markets will react within minutes, and Bitcoin will move with risk assets. That is why this article was written pre-CPI and says so plainly. If you read the CoinDesk page on Tuesday evening, expect the number to jump. Do not mistake the jump for a trend. Wait for the daily close, check the volume, and read what actually changed in the report before you act. Our Bitcoin November outlook explains the $76,000 support question that the CPI release will now test from below.
Frequently Asked Questions
1. What is the bitcoin btc usd current price on CoinDesk right now?
It is the current value of the CoinDesk Bitcoin Price Index (XBX) in US dollars. On the evening of Monday 9 November 2026 it was about $75,394, with a day low of $73,510. Refresh the page for the live figure, because it moves every few seconds.
2. Is the CoinDesk price the same as the Binance price?
No. CoinDesk shows an index blended from several exchanges. Binance shows its own last trade. The two usually sit within a few dozen dollars of each other, but they can differ by more during fast moves.
3. What is the CoinDesk Bitcoin Price Index (XBX)?
It is CoinDesk Indices’ reference rate for Bitcoin in US dollars, built from prices on leading exchanges. It is used as a benchmark for investment products holding more than $21 billion in assets.
4. How often does the CoinDesk price update?
It updates continuously through the day as the underlying exchange prices move. In calm markets the change is small. In a whipsaw it can move hundreds of dollars between refreshes.
5. Can I buy Bitcoin at the CoinDesk price?
No. The index is a reference rate, not an order book. You buy on an exchange at that exchange’s price, plus its fee and spread. Use CoinDesk for context and your exchange for the trade.
6. Why does CoinDesk show a different price from CoinGecko?
They measure different things. CoinDesk uses its own index of leading exchanges. CoinGecko averages across many more venues. Both are valid, and the gap between them is usually small.
7. What should I check on the page besides the price?
Check the 24-hour high and low, the 24-hour volume, the market cap, and the news beside the price. Together they tell you whether a move is strong, thin, or driven by a headline.
8. What does market cap mean on the CoinDesk page?
It is the current price multiplied by the number of coins in circulation. In November 2026 it was about $1.5 trillion for Bitcoin. It shows the size of the asset, not how much money flowed in that day.
9. Is the CoinDesk price page free?
Yes. Reading the price page, the chart and the market data is free. CoinDesk also runs paid products and licensed index data for institutions, but the public price page costs nothing.
10. Will the CPI report on Tuesday move the CoinDesk Bitcoin price?
Almost certainly, in the short term. The CPI lands on Tuesday 10 November at 18:30 PKT. Bitcoin trades with risk assets around big macro releases, so expect a sharp move and wait for the daily close before judging it.
If the index idea is new to you, our blockchain technology in simple terms guide and our detailed blockchain technology explanation cover the basics the price sits on, and our blockchain node guide explains the network that keeps those prices honest.
Conclusion
The CoinDesk price page is one of the best starting points for following Bitcoin — if you read it the right way. Its headline number is a careful index, not a shop price. Its chart, volume, range and news turn that number into a story you can test. In a week when Bitcoin fell to $73,510, bounced above $75,000, and now waits for the CPI report, that discipline matters more than ever. Use CoinDesk to understand the market, use your exchange to trade it, and never let one flashing number make the decision for you.
For the full picture, read our Bitcoin price history 2025–2026, our price history API guide, and our blockchain wallet guide before you move any coins. And tell us: when you check the price, do you trust the index, your exchange, or neither until both agree?
External sources: CoinDesk (price page and XBX), CoinDesk, 9 Nov 2026: Bitcoin’s drop and pop triggers $1 billion in liquidations, US Bureau of Labor Statistics, CPI.