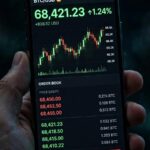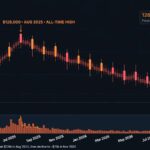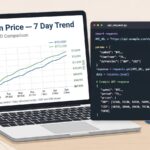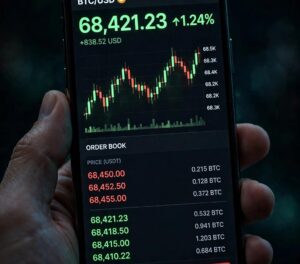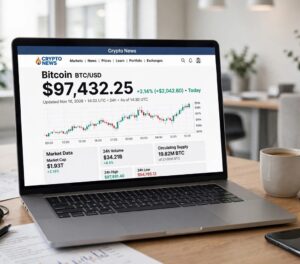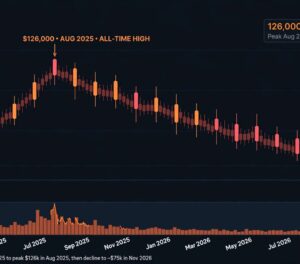


Meena refreshed her phone three times in one minute on the night of 8 November 2026. The first refresh said $75,600. The second said $74,100. The third said $73,761. She had not broken her phone. She had watched a live market do what live markets do. The bitcoin btc usd live price is not a single fixed number waiting on a shelf. It is a stream of trades, stitched together by exchanges, aggregators and data feeds, and it changes every second. This guide explains how that stream is built, why two honest sources can disagree, and how to use a live price without letting it use you.
Price at time of writing — read this first: BTC was about $74,830 on Tuesday 10 November 2026 at 10:24 PKT (05:24 UTC, Finnhub, Binance BTC/USDT), with the day so far ranging $73,750 to $75,568 and a change of about +0.3% against the previous close; Monday 9 November closed at $74,900 after a $73,510 low. The 200-day moving average sat near $73,150, and the Fear & Greed Index read 32 (29 the day before), which means fear. The US CPI report lands on Tuesday evening at 18:30 PKT and prices move fast around it, so check a live feed for the current figure. Nothing in this article is a price prediction.
For the story behind today’s level, read our Bitcoin price history 2025–2026. For one trusted benchmark page, read our CoinDesk Bitcoin price guide. This article is about the machinery underneath both of them.
Executive Summary
- There is no single live price for Bitcoin. Every venue prints its own last trade, and every aggregator blends those trades into its own average.
- Spot prices and perpetual-futures prices are different things. They usually sit close together, but they can split apart when leverage unwinds.
- Small gaps between venues are normal. A difference of a few dozen dollars means nothing. A gap of several hundred dollars means something is happening on one venue.
- On 8–9 November 2026 Bitcoin fell to $73,761, its lowest since August, then bounced above $75,000. More than $1 billion in leveraged positions was liquidated in 24 hours.
- Live prices are built for watching, not for panicking. Alerts, limit orders and a daily-close habit beat constant refreshing.
- The US CPI report lands on Tuesday 10 November at 18:30 PKT. Expect the live price to jump around that release, and wait for the close before judging it.
What “Live Price” Really Means
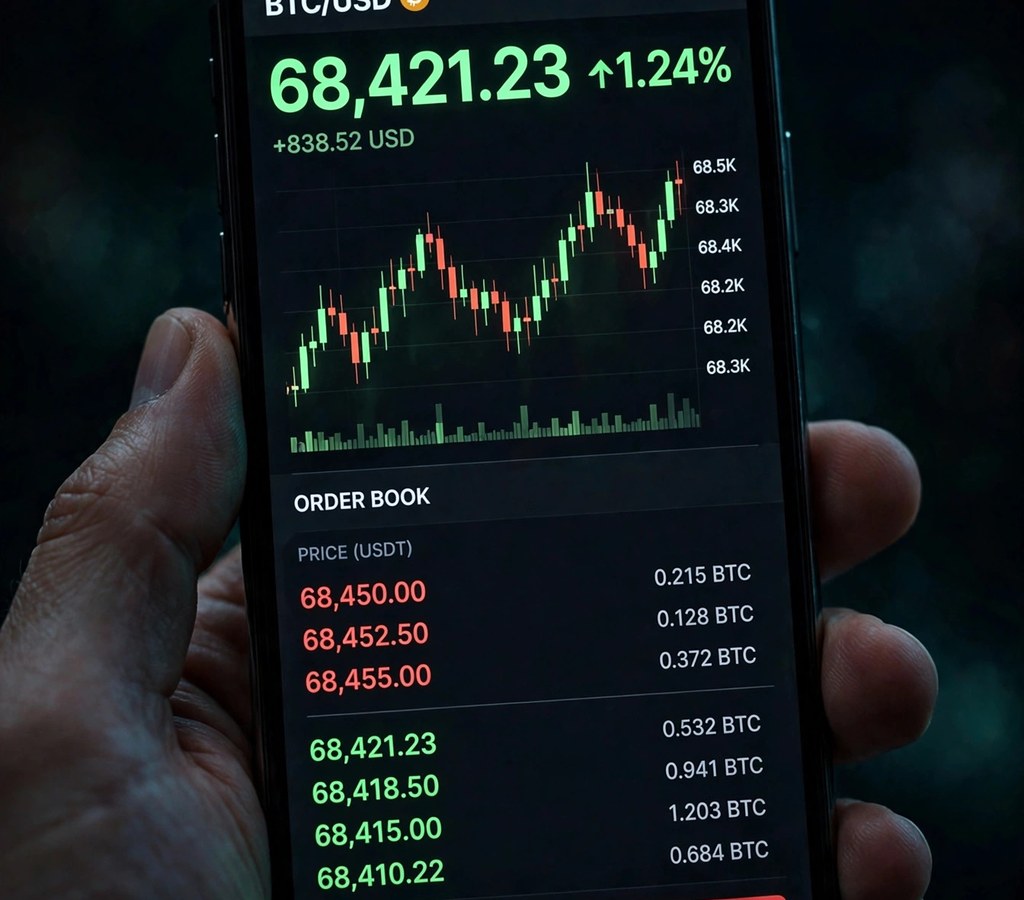
When a website shows a bitcoin btc usd live price, it shows the most recent price its data feed has received. That sounds simple, but three choices hide inside it. Which venue did the feed watch? Which trade counted as the latest one? And how old is the number on your screen? Each choice changes the figure by a little, and in a fast market a little becomes a lot.
Think of it like a cricket score. Two channels can both be right and still show different scores for a few seconds, because one updates faster than the other. Bitcoin trades 24 hours a day, seven days a week, on hundreds of venues at once. There is no closing bell and no single official price. A live price is always a report from somewhere, at some moment, about a market that never sleeps.
Where a Live Price Comes From: Exchanges First
Every live price starts on an exchange. A buyer and a seller meet in an order book, agree a price, and a trade prints. That printed trade is the raw material. Binance, Coinbase, Kraken, Bitstamp and OKX each print their own trades, and each one is a real price at which real money changed hands.
An exchange price is the only price you can actually trade at. If Binance shows $75,100, you can buy or sell near $75,100 on Binance, subject to the spread and the depth of its order book. But that price belongs to Binance alone. On the same second, Coinbase might print $75,240. Neither venue is wrong. They simply have different buyers, different sellers, and different order books.
Our blockchain explorer guide shows how to check what is happening on-chain while prices move, and our Bitcoin price history API guide explains the data feeds that carry these prices to websites and apps.
Aggregators: How CoinGecko and CoinMarketCap Blend the Market
Most people do not watch one exchange. They watch an aggregator such as CoinGecko or CoinMarketCap. An aggregator collects the last trade from many exchanges, weights each one by its trading volume, and publishes one average. The result is a smoother number that represents the whole market rather than one venue.
Aggregation solves one problem and creates another. It smooths out a spike on a single thin exchange, which is good. But it also hides real differences. If one large exchange halts withdrawals, its price can drift away from the rest of the market, and the average will quietly absorb that drift. A careful reader therefore checks an aggregator for the big picture, and one or two big exchanges for the truth on the ground.
| Source type | What it shows | Updates | Best use |
|---|---|---|---|
| Exchange | Last trade on that venue | Every trade, in milliseconds | The price you will actually get |
| Aggregator | Volume-weighted average | Every few seconds | The market-wide picture |
| Index (e.g. XBX) | Reference rate from leading venues | Continuously | A benchmark for funds and news |
| API feed | Raw data for apps and bots | As fast as you poll it | Building alerts, widgets and charts |
| News ticker | A snapshot with a story | When the story updates | Context, not execution |
Spot vs Perpetuals: Two Prices That Usually Agree — Until They Do Not
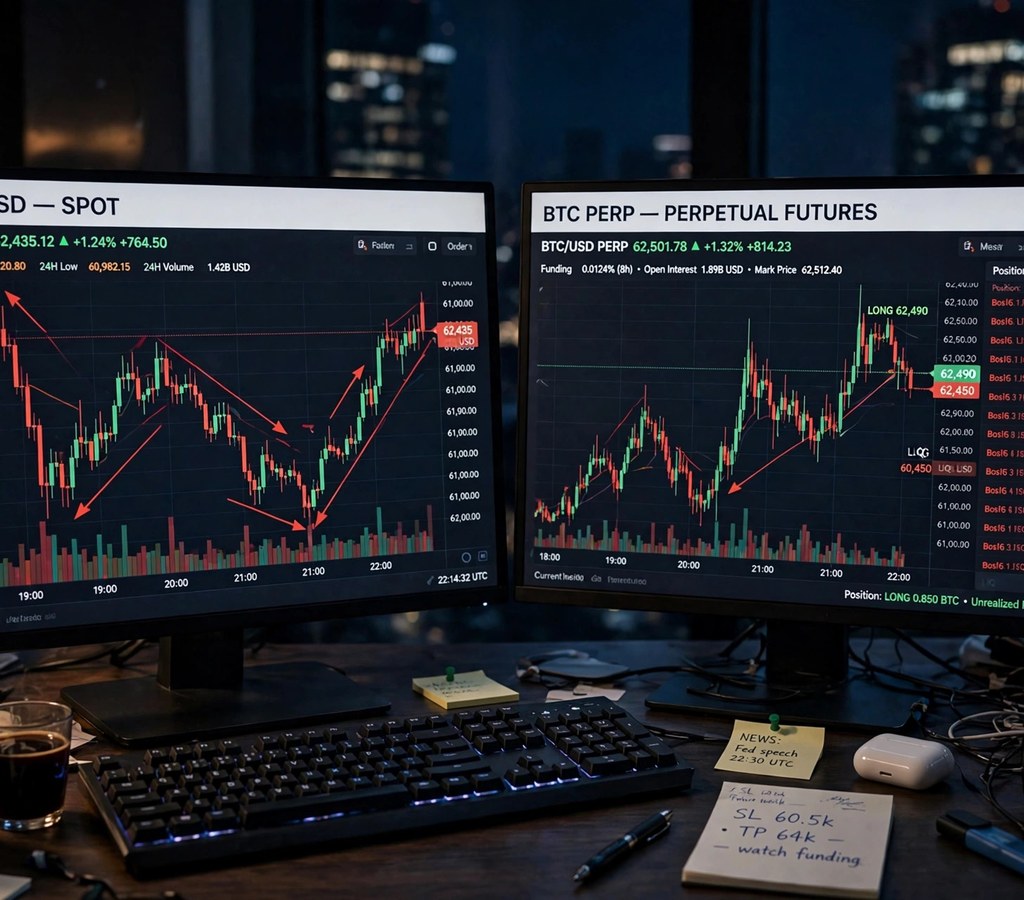
Beginners often see two Bitcoin prices on the same exchange and assume one is wrong. One is the spot price: the price of actual Bitcoin changing hands now. The other is the perpetual futures price: the price of a contract that tracks Bitcoin without an expiry date. They usually sit within a few dollars of each other, held together by traders who buy the cheaper one and sell the dearer one.
When leverage unwinds, the two can split. On 8–9 November 2026, more than $1 billion in leveraged positions was liquidated in 24 hours, with about $272 million of it in Bitcoin alone. Forced selling hits the perpetuals market first, because that is where the leverage lives. The spot market follows, but not always at the same speed. If you watch a live price during a liquidation cascade, you may be watching the futures price drag the spot price down, not the other way round.
Why the Same Coin Costs Different Amounts in Different Places
Five forces pull venue prices apart. First, liquidity: a deep order book absorbs large orders without moving; a thin one jumps. Second, fees and spreads: a venue with wide spreads shows a mid-price that nobody can actually trade at. Third, stablecoin pairs: a price quoted in USDT is not identical to one quoted in USDC or in dollars, because the stablecoins themselves can trade a fraction off a dollar. Fourth, local demand: a venue popular in one country can carry a premium when local buyers rush in. Fifth, outages and halts: a venue that stops withdrawals can trade at a discount for hours, as holders sell at any price to get out.
None of this means the market is broken. It means the market is many markets, loosely tied together by traders who move coins and money between venues for a small profit. That tying together, called arbitrage, is what keeps the gaps small most of the time.
How Live Pricing Travels: APIs, Widgets and Alerts
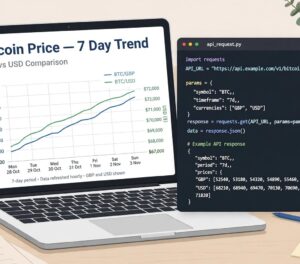
Behind every price widget sits an API — a data feed that apps and websites poll for the latest numbers. Our price history API guide walks through the public feeds in detail. The short version is this: an app asks the feed “what is the price now?”, the feed answers, and the app displays it. Ask once a minute and you get a slow ticker. Ask every second and you get a live one, but you also pay more, either in money or in rate limits.
That is why free widgets lag during volatility. They poll slowly to stay free. A professional terminal polls fast and pays for it. If your widget shows $75,000 while your exchange shows $74,600, do not assume either is lying. Check the timestamp on the widget. It may be a minute old, and a minute is a long time in a whipsaw.
Setting Alerts That Help Instead of Hurting
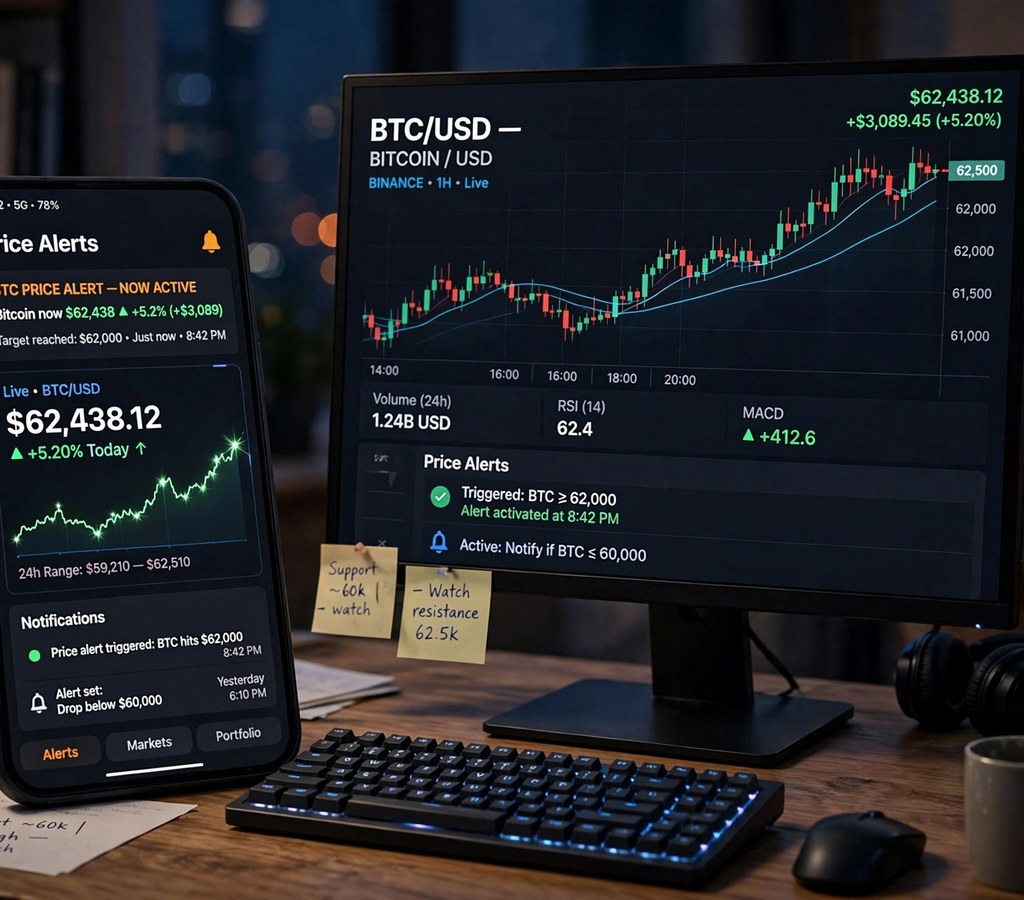
Alerts are the best use of a live price, and the easiest to misuse. Set an alert at a level that matters — a support level such as the 200-day average near $73,150, or a resistance level such as the 100-day average near $77,430 — and then stop watching. An alert that fires once a day is useful. An alert that fires every five minutes is just anxiety with a ringtone. Set price alerts, not time alerts, and decide in advance what you will do when each one fires.
Step by Step: Using a Live Price Properly
Step 1: Pick one benchmark and one execution venue
Choose an aggregator or index as your benchmark, and your own exchange as your execution venue. Learn the normal gap between them in calm markets, so you can spot an abnormal gap when it appears.
Step 2: Read the range, not the dot
A live price is a dot. The 24-hour high and low are the range. On 9 November the range ran from $73,510 to about $76,100. A dot at $75,394 means far more once you know the range it sits inside.
Step 3: Check volume before you trust a move
A $1,000 move on heavy volume means many traders acted. The same move on thin volume may mean one large order in a quiet hour. Volume is the weight behind the price, and a live price without volume is a headline without a source.
Step 4: Confirm on a second source before acting
If your app and your exchange disagree by more than a few hundred dollars, stop. Check a second aggregator, check the news, and check whether one venue has an outage. A disagreement is information, not a glitch to ignore.
Step 5: Decide, then stop refreshing
Set your order, set your alert, and walk away. Refreshing a live price every few seconds does not give you more information. It gives you more noise, and noise is what turns a plan into a panic trade.
Case Studies: Five Days When Live Pricing Mattered
Case Study 1: The Sunday-night whipsaw, 8–9 November 2026
Problem: Bitcoin fell from above $75,600 to about $73,761 in an hour late on Sunday, its lowest since August, then recovered above $75,000. Strategy: traders who watched only a live dot saw chaos. Traders who watched the range, the volume and the news saw a macro-driven flush. Execution: the patient ones did nothing; the leveraged ones were liquidated. Results: over $1 billion in leveraged positions was wiped out in 24 hours, and the Fear & Greed Index sat at 29, in fear. Lesson: in a whipsaw, the live price is a weather report, not an instruction.
Case Study 2: The Binance hack and the price that did not collapse
Problem: in late October 2026 Binance suffered a security incident with an estimated impact of about $6.3 billion, of which about $3 billion was frozen. Strategy: holders watched the live price for a collapse that never came in full. Execution: Binance said it would cover all losses, replenished about 98% of the affected assets, and reopened withdrawals in phases. Results: the price fell with the wider market in November, but not in a single exchange-driven crash. Lesson: a live price reflects the whole market’s judgement, not one venue’s trouble. Our price history guide covers the hack and the recovery in full.
Case Study 3: ETF outflows flip the year negative
Problem: US spot Bitcoin ETFs posted $1.28 billion in weekly net outflows, flipping 2026 year-to-date flows negative. Strategy: readers who only watched the live price saw a slow slide. Readers who watched flows saw the cause. Execution: the outflows came week by week, and the price followed them down. Results: by 9 November Bitcoin was down about 29% over twelve months and about 15.8% year to date. Lesson: flows move prices over weeks. A live price shows the effect; the flow data shows the cause.
Case Study 4: The $80,000 reclaim that lasted a day
Problem: after the US midterms, Bitcoin jumped above $80,000 and live-price apps lit up. Strategy: the move was real, but the live price alone could not say whether it would hold. Execution: traders who waited for a daily close above $80,000 stayed out. Results: the price fell back below $75,600 within two days. Lesson: a live price tells you where you are. Only a close tells you where you stayed. Read our midterms history article for the longer pattern.
Case Study 5: Red October, read in the monthly price
Problem: October 2026 was Bitcoin’s weakest October since 2014, and demand went negative according to CryptoQuant. Strategy: the daily live price showed small red days. The monthly chart showed the real story. Execution: holders who zoomed out saw the grind lower for what it was. Results: the month set up the November slide to $73,510 instead of surprising anyone with it. Lesson: a live price is a microscope. Sometimes you need the telescope. Our Red October article walks through that month.
Common Mistakes With Live Prices
The first mistake is refreshing constantly. It feels like research, but it is just watching noise. The second is trading the live price instead of a plan. A plan says “I buy at $73,000 or I sell at $80,000”. A live price says “it is $74,600 now”, which is not a plan. The third is trusting one venue’s spike. If your exchange jumps $500 while every aggregator stays flat, your exchange has the problem, not the market. The fourth is ignoring fees and spreads. A live price of $75,000 with a $200 spread is not a $75,000 price for you. The fifth is reading a price in the wrong currency and converting with a stale rate. Always check the pair: BTC/USD is not BTC/USDT, and neither is BTC/EUR.
Tools and Resources: 12 Ways to Follow the Live Price
1. Binance
Pros: deepest liquidity, fastest live feed, full order book. Cons: its own price can spike alone. Pricing: free to view; trading fees apply. Best for: the price you can actually trade.
2. Coinbase
Pros: clean live price, regulated US venue, simple alerts. Cons: higher fees than some rivals. Pricing: free to view; trading fees apply. Best for: a trusted second venue.
3. Kraken
Pros: reliable feed, strong security, good charts. Cons: fewer coins than the largest exchanges. Pricing: free to view; trading fees apply. Best for: cross-checking a live quote.
4. CoinGecko
Pros: free live prices across many venues, good history. Cons: averages include smaller venues. Pricing: free; paid API for heavy use. Best for: the market-wide live picture.
5. CoinMarketCap
Pros: live rankings, dominance and market cap together. Cons: volume figures need care. Pricing: free; paid API plans. Best for: live market structure.
6. TradingView
Pros: the best live charting, custom alerts, many feeds. Cons: you must pick the feed yourself. Pricing: free tier; paid plans for more alerts. Best for: watching a level, not a dot.
7. CryptoCompare / CCData
Pros: exchange benchmarks, clean aggregated feeds. Cons: some data behind paid tiers. Pricing: free basics; paid data plans. Best for: judging which venues to trust.
8. CoinDesk
Pros: index-based live price with news beside it. Cons: the index is not a tradable price. Pricing: free to read. Best for: a benchmark with context.
9. Bitstamp
Pros: one of the oldest venues, clean and simple feed. Cons: thinner liquidity than the giants. Pricing: free to view; trading fees apply. Best for: a long-running independent quote.
10. OKX
Pros: deep derivatives markets, fast live data. Cons: derivatives prices can lead spot during liquidations. Pricing: free to view; trading fees apply. Best for: watching futures pressure.
11. CoinAPI
Pros: one feed for many exchanges, built for developers. Cons: a developer tool, not a casual app. Pricing: free tier; paid plans by volume. Best for: building your own ticker or alerts.
12. Kaiko
Pros: institutional-grade live data, careful venue selection. Cons: priced for professionals. Pricing: paid, with limited free data. Best for: verifying data quality.
| Tool | Live price type | Cost to watch | Best for |
|---|---|---|---|
| Binance | Exchange last trade | Free to view | Execution |
| CoinGecko | Multi-exchange average | Free | Market-wide view |
| CoinDesk / XBX | Index | Free | Benchmark + news |
| TradingView | Your chosen feed | Free tier | Alerts and charts |
| CoinAPI | Raw API feed | Free tier | Building your own ticker |
Live Price, Widgets and the CPI Release on Tuesday
The US CPI report for October 2026 lands on Tuesday 10 November at 8:30 a.m. ET, which is 18:30 PKT. The previous reading was 3.7% year on year, with core inflation at 2.6%. Around that release, live prices will jump. Your widget may lag. Your exchange may show a wide spread. Your alerts may fire several times in a minute. None of that is a signal on its own. Decide your levels before the release, set your alerts, and judge the move on the daily close, not on the first five minutes. Our Bitcoin November outlook explains the $76,000 support question that the CPI release will now test from below, and our blockchain wallet guide is the place to start if the volatility makes you rethink where your coins sit.
Frequently Asked Questions
1. What is the bitcoin btc usd live price right now?
It depends on the source, because every venue prints its own last trade. On the evening of Monday 9 November 2026 the market was around $75,394, with a day low of $73,510. Check a live feed for the current figure, and note its timestamp.
2. Why does the live price differ between Binance and Coinbase?
Each exchange has its own order book, buyers and sellers. Their last trades can differ by a few dozen dollars. Arbitrage keeps the gap small, but it never makes it zero.
3. Is the live price on CoinGecko the same as on an exchange?
No. CoinGecko shows a volume-weighted average across many exchanges. An exchange shows its own last trade. The average is smoother; the exchange price is the one you can trade.
4. What is the difference between the spot price and the perpetual futures price?
The spot price is the price of actual Bitcoin. The perpetual price is the price of a contract tracking Bitcoin with no expiry. They usually sit close together, but they can split when leveraged positions are liquidated.
5. Why did Bitcoin fall to $73,761 on 8 November and bounce so fast?
Macro headlines — an investigation touching the Nvidia chief executive and stalled US–Iran talks — rattled risk markets late on Sunday. Leveraged longs were liquidated, which pushed the price down fast, and buyers stepped in near the 200-day average around $73,150.
6. How fast do live price widgets update?
It depends on the feed. Exchange feeds update in milliseconds. Free widgets often poll every few seconds or every minute, so they can lag during fast moves. Always check the timestamp on the price you are reading.
7. Can I trust a live price from a news website?
Use it for context, not for trading. News tickers show snapshots, and they can be minutes old. For a trade, always check the live quote on your own exchange at that moment.
8. What is a good way to follow the price without watching it all day?
Set price alerts at levels that matter, such as $73,150 support and $77,430 resistance, and check the daily close once a day. Alerts plus a daily check beat constant refreshing.
9. Does the live price include fees?
No. The live price is the mid-market or last-trade figure. Your exchange will add its fee and its spread on top, so the price you actually pay is always a little worse than the number on the screen.
10. Will the CPI report on Tuesday move the live Bitcoin price?
Almost certainly in the short term. The CPI lands on Tuesday 10 November at 18:30 PKT. Expect sharp moves in the first minutes, wide spreads, and lagging widgets. Judge the move on the daily close, not on the first print.
Conclusion
A bitcoin btc usd live price is not a fact carved in stone. It is a report from a market that never closes, built from trades on many venues, blended by aggregators, and delivered to your screen with a small delay. Used well, it tells you where the market is, how fast it is moving, and whether a move has weight behind it. Used badly, it becomes a flashing number that trades for you — and usually trades badly. Pick one benchmark, pick one execution venue, set alerts at levels that matter, and let the daily close do the talking.
Read the set together: our Bitcoin price history 2025–2026, our CoinDesk price guide, and our price history API guide. Then tell us: do you watch the live price, set alerts and walk away, or check the daily close once a day — and which one has saved you more money?
External sources: CoinDesk (price and market data), CoinDesk, 9 Nov 2026: Bitcoin’s drop and pop triggers $1 billion in liquidations, US Bureau of Labor Statistics, CPI.