

Tom built a small price widget for a UK crypto newsletter. His readers wanted one simple thing: Bitcoin’s price over the last 7 days, in pounds and in dollars, updated every hour. He started by copying numbers from a price website by hand. By Wednesday the numbers were stale, the pounds were wrong, and a reader emailed to point out that his “7-day low” was actually from two weeks ago. Tom needed a live feed, not a copy-paste job. What he needed was a Bitcoin price history API — and the right one took him less than an hour to wire up.
A price history API returns past Bitcoin prices as data your app can read: timestamps, prices, and volumes, in the currency you ask for. This guide shows how to get 7 days of Bitcoin price history in GBP and USD from the main free APIs, compares their limits and prices, and works through a real 7-day example using prices checked on 8 November 2026. If you are new to how prices are set in the first place, our Bitcoin Fed-decision analysis explains how macro news moves the price, and our plain-English blockchain guide explains the network behind the asset.
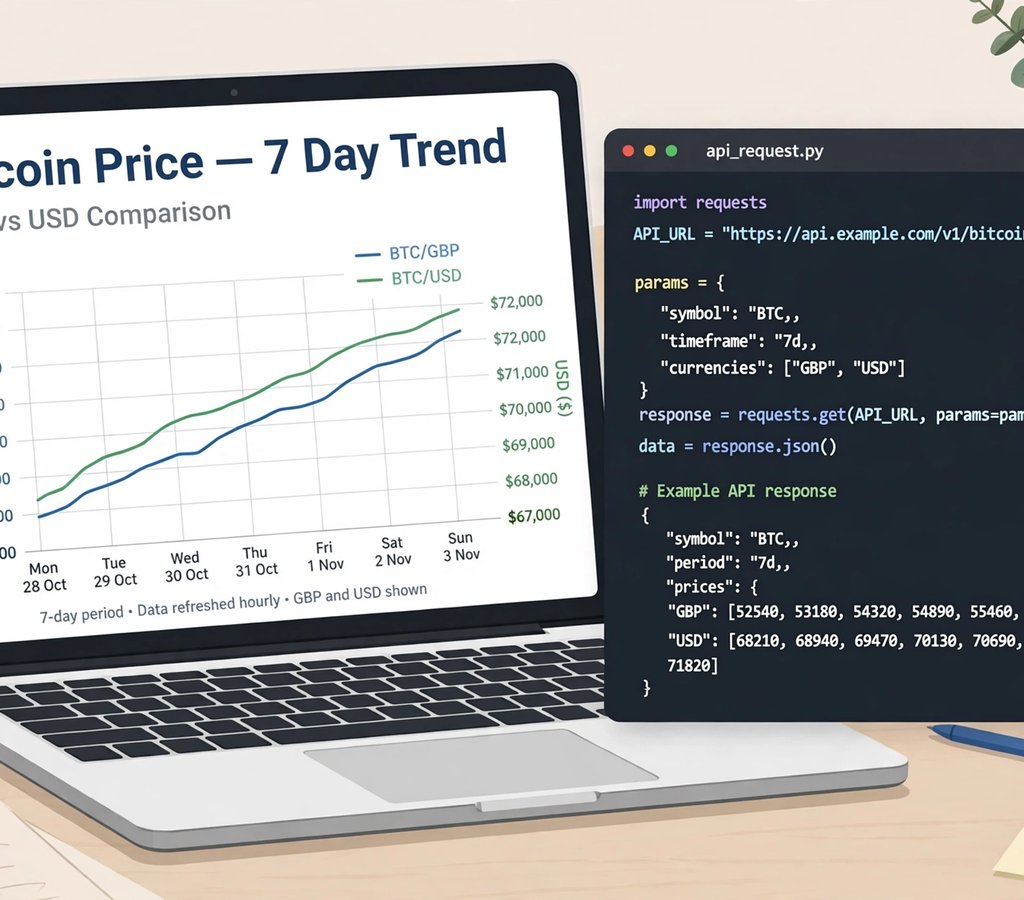
Executive Summary
- The easiest free route is CoinGecko. One endpoint — /coins/bitcoin/market_chart — returns 7 days of prices in GBP or USD, with no key needed on the Demo plan.
- Binance is the fastest free route for traders. Its public klines endpoint needs no key and returns candlesticks for BTC/USDT and BTC/GBP pairs.
- Always ask for the currency in the request. A price in USD is not a price in GBP — the API must do the conversion, or you must apply a live GBP/USD rate yourself.
- Seven days means hourly data on most APIs. CoinGecko returns hourly points for ranges up to 90 days; daily closes need a different endpoint or your own aggregation.
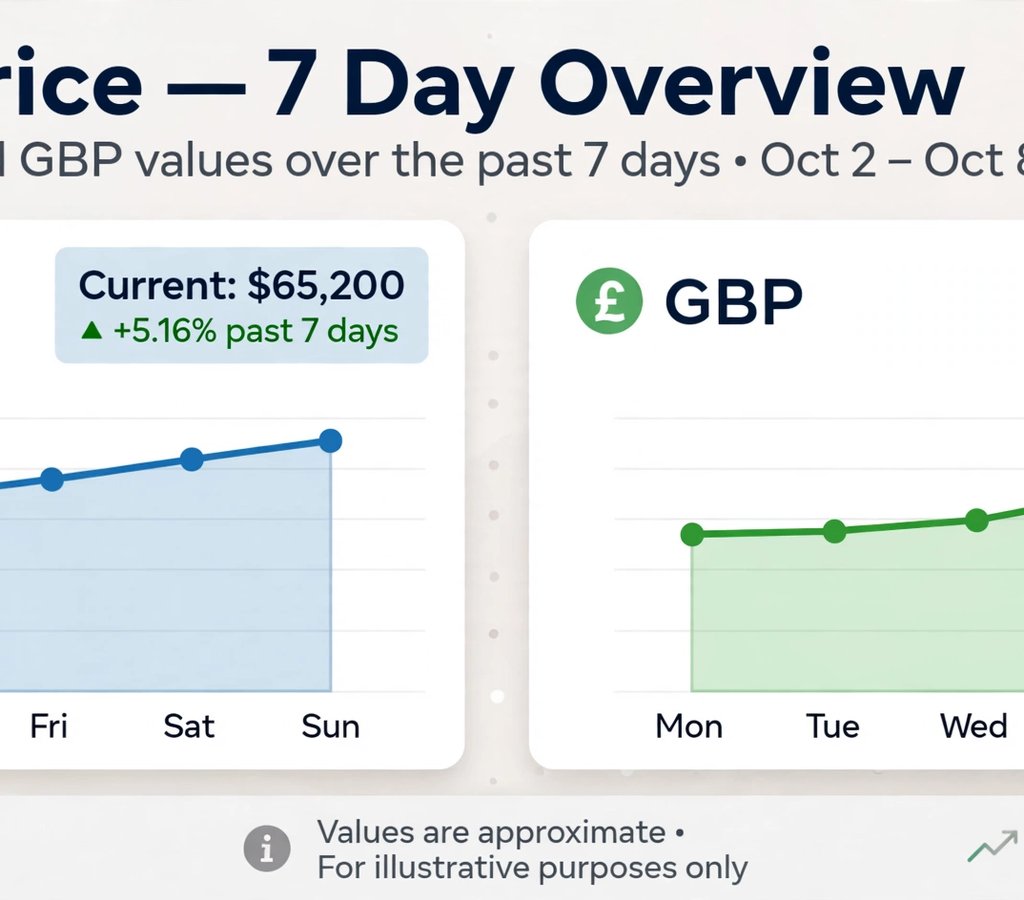
- The last 7 days were a down week. As of the morning of 8 November 2026, Bitcoin traded near $75,900, down about 2.3% over 7 days, with a 7-day range of roughly $74,840 to $81,180.
- Free tiers are enough for a widget or a spreadsheet. You only need a paid plan when you poll often, track many coins, or serve many users.
What Is a Bitcoin Price History API?
A Bitcoin price history API is a web service that returns past Bitcoin prices — usually as a list of timestamps with a price, market cap, and volume at each point — so your app, spreadsheet, or website can display a chart without scraping a price website.
You send a request such as “give me Bitcoin’s price for the last 7 days in GBP” and the API returns a structured list you can plot, store, or compare. The three numbers that matter in every response are the price, the timestamp, and the currency. If any one of them is unclear, the chart is wrong. A timestamp without a timezone, a price without a currency, or a “daily close” taken at a different hour than you expected will all produce a chart that looks right and is wrong.
There are two kinds of price API. Market-data APIs such as CoinGecko aggregate prices across many exchanges and give you one reference price. Exchange APIs such as Binance or Coinbase give you the price on that one exchange. The two usually differ by a few dollars — that difference is real, and it is why your widget should say where its price comes from. For a general audience, an aggregated price is the honest choice. For a trader, the price on their own exchange is the one that matters, because that is where their order will fill. Our Bitcoin options expiry explainer shows how traders use exchange-specific data when real money is on the line.
The 7-Day Picture: Bitcoin in USD and GBP (8 November 2026)
Before the endpoints, here is the week itself, using prices checked on the morning of Sunday 8 November 2026. Treat this as a worked example of what the API returns — not as a price tip. By the time you read this, the numbers will have moved, and that is exactly why you fetch them live instead of copying them from an article.
| Measure | USD | GBP (approx.) | Source | |
|---|---|---|---|---|
| Current price, 8 Nov morning | About $75,900 | About £56,700 | Finnhub / Hotcoin, 8 Nov | |
| 24-hour range | $75,571 – $76,250 | — | Finnhub, 8 Nov | |
| 7-day change | About −2.3% to −2.5% | About −2.3% | Multiple price trackers, 8 Nov | |
| 7-day high | About $81,150 – $81,180 | About £60,700 | Hotcoin / ChipaX, 8 Nov | |
| 7-day low | About $74,840 – $74,890 | About £56,000 | Hotcoin / ChipaX, 8 Nov | |
| 30-day change | About −7.3% | — | Finnhub, 8 Nov |
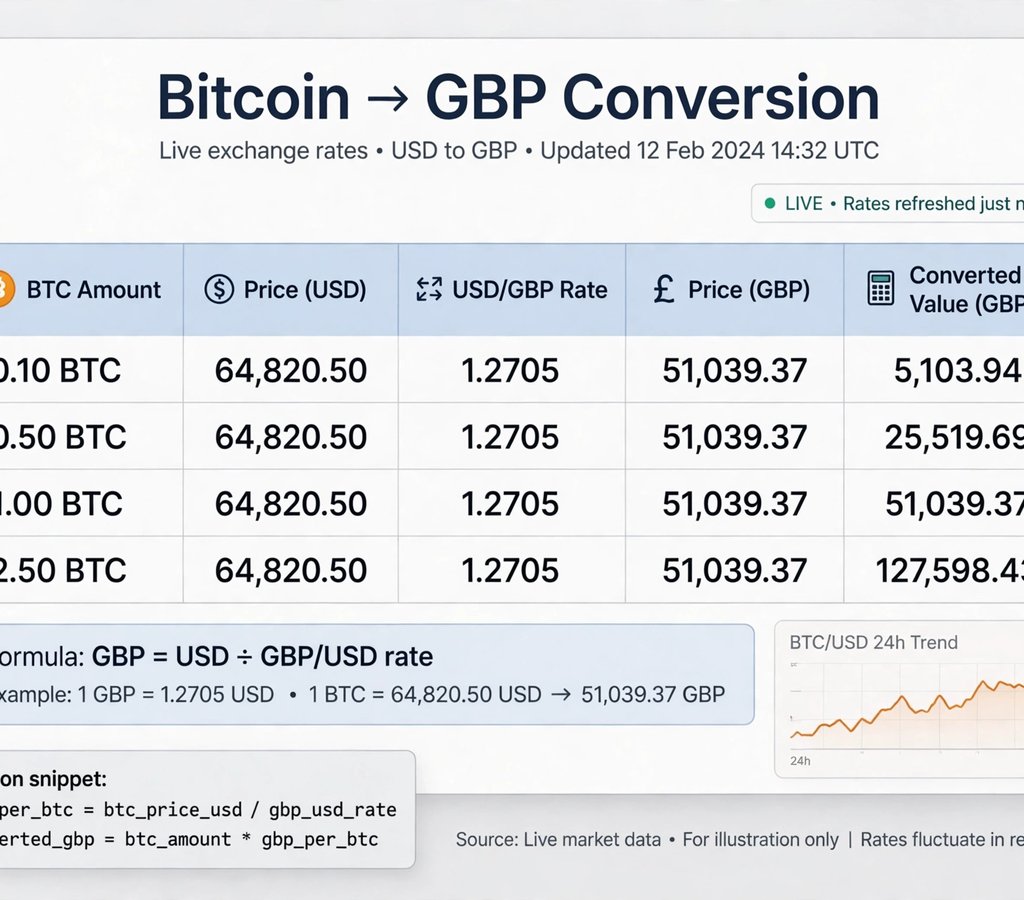
Read the week like this: Bitcoin spent the last 7 days sliding from above $81,000 to below $76,000, with the low near $74,850. The move was orderly rather than panicked — a steady drift down of about 2.3% on the week, inside a 30-day fall of about 7.3%. The pound figures track the dollar figures closely because GBP/USD barely moved over the same days; 1 BTC at about $75,900 converts to roughly £56,700 at the rate implied by the same morning’s data — you can see the live conversion on CoinGecko’s BTC to GBP page. If you build a GBP chart, do not hard-code a conversion rate. Ask the API for GBP directly, or fetch a live FX rate with every update — a stale rate makes your GBP chart wrong even when your USD data is perfect. Our detailed explanation of blockchain technology and our blockchain mining guide explain the network activity behind these price moves.
A note on honesty: different trackers show slightly different 7-day highs and lows ($81,154 versus $81,177, for example). That is normal. Each source samples at different times and aggregates different exchanges. Your API will have its own exact numbers. What matters is that you use one source consistently and name it on the chart. Our Bitcoin bear-market analysis uses the same discipline: one source, named, for every price claim.
CoinGecko API: The Easiest Free Route
CoinGecko runs the world’s largest independent crypto data service, and its API is the default choice for a 7-day price chart. The endpoint you want is documented on CoinGecko’s API page, which also publishes the Demo plan’s limits:
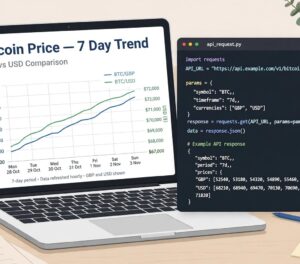
GET /coins/bitcoin/market_chart?vs_currency=gbp&days=7
Change gbp to usd for dollars. The response contains three arrays — prices, market caps, and total volumes — each a list of [timestamp, value] pairs. For a 7-day range you get hourly points, which is ideal for a smooth chart. For ranges under a day you get minute-level data; for ranges over 90 days you get daily points.
If you need one price per day instead of hourly points, use the history endpoint with a date: GET /coins/bitcoin/history?date=01-11-2026 (day-month-year format). Call it once per day for seven days and you have a clean daily table. The simple price endpoint, /simple/price?ids=bitcoin&vs_currencies=gbp,usd, gives you the current price in both currencies in one call — useful for the “current price” line above your chart.
| CoinGecko plan | Monthly calls | Rate limit | Price |
|---|---|---|---|
| Demo (free) | 10,000 | About 30–100 calls/min as published | $0, no card needed |
| Paid plans | 100,000+ | Higher, faster updates | From $35/month as published |
For a 7-day chart updated hourly, the Demo plan is far more than enough: 24 calls a day for prices, or a handful of calls if you cache the result. The paid plans matter when you track many coins, poll every minute, or serve heavy traffic. Historical data goes back 13+ years on the market_chart endpoint, subject to your plan. One practical warning: the free Demo API caches data for around 1 to 5 minutes, so do not expect tick-by-tick prices. For a daily or hourly chart, that delay is invisible.
Binance API: The Trader’s Free Route
Binance’s public market-data endpoints need no API key at all, which makes them the fastest way to get candlestick history. The endpoint is:
GET /api/v3/klines?symbol=BTCUSDT&interval=1h&limit=168
That returns 168 hourly candles — exactly 7 days. Each candle gives you open, high, low, close, and volume. For pounds, use BTCGBP if the pair is listed, or take BTC/USDT and convert with a live GBP/USD rate. Binance also offers a simple ticker endpoint for the current price, and its data is the price on Binance itself — the largest exchange by volume — rather than an average across exchanges.
The limits are generous for public endpoints, but they are shared and enforced by IP, so add a small delay between calls and cache aggressively. The main weakness is coverage: Binance gives you exchange prices, not an aggregated market price, and its history for a pair starts when that pair started trading. For a 7-day chart, neither matters. For a 5-year chart, use CoinGecko instead.
Coinbase, Kraken, and the Other Free Options
Coinbase Exchange offers a public candles endpoint: GET /products/BTC-GBP/candles returns candlesticks for the BTC-GBP pair directly — no conversion needed, and no key required for public market data. That makes it the cleanest option if your audience is British and your chart is in pounds. Kraken’s public OHLC endpoint works the same way for its BTC/GBP pair, and Bitstamp offers a similar public transactions and ticker history.
For a no-key, no-signup alternative built for small projects, several lightweight services offer a 7-day history endpoint with a days parameter — for example, a history endpoint that takes ?days=7 and returns daily points, free at a few requests per hour. These are handy for a prototype, but check their data source before you rely on them: a price feed that does not name its exchanges is a price feed you cannot audit. When in doubt, use CoinGecko, Binance, or Coinbase, whose sources are public and whose uptime you can monitor.
Comparing the Main Bitcoin Price History APIs
| API | 7-day endpoint | GBP support | Key needed | Free tier | Best for |
|---|---|---|---|---|---|
| CoinGecko | /coins/bitcoin/market_chart | Yes, vs_currency=gbp | No (Demo) | 10,000 calls/month | Charts and widgets |
| Binance | /api/v3/klines | BTCGBP pair / convert | No | Public, generous | Trading and candles |
| Coinbase Exchange | /products/BTC-GBP/candles | Yes, direct pair | No | Public | UK audience, GBP charts |
| Kraken | Public OHLC endpoint | Yes, BTC/GBP pair | No | Public | Regulated-exchange prices |
| CoinPaprika | Historical OHLCV | Yes, via quote currency | No | Free tier | Quick research |
| CoinCap | /assets/bitcoin/history | USD native, convert | No | Free tier | Simple apps |
| CryptoCompare | histohour endpoint | Yes, tsym=GBP | Free key | Free tier | Hourly history |
Step by Step: Build Your 7-Day GBP/USD Chart
Step 1: Pick one source and name it
Choose CoinGecko for a general audience, Binance for traders, or Coinbase for a UK audience. Put the source name under your chart. Readers trust a chart that names its source.
Step 2: Fetch USD and GBP in parallel
Call the endpoint twice — once with vs_currency=usd and once with vs_currency=gbp — or call the simple price endpoint for both currencies at once. Never convert with yesterday’s exchange rate.
Step 3: Decide hourly or daily
For a 7-day chart, hourly points (168 of them) look smooth and show the real shape of the week. For a table, aggregate to one close per day — take the last point of each calendar day, and say so in a footnote.
Step 4: Cache, then poll
Store the response and update it every hour, or every few minutes at most. Polling every few seconds wastes your free allowance and changes nothing on an hourly chart.
Step 5: Handle the gaps
APIs go down. When a call fails, show the last good data with a “last updated” timestamp instead of a blank chart or a wrong number. A stale chart with a timestamp is honest; a blank chart looks broken, and a guessed number is worse than either. If you want to understand what moves the numbers you are charting, our Ethereum ETF outflow report and our blockchain node guide both show how on-chain and market data connect — and our guide to how blockchain works and our EVM explainer cover the mechanics underneath the price.
Case Studies: Price History APIs in Real Life
Case study 1 — Tom’s newsletter widget. Problem: Tom copied prices by hand and his 7-day figures kept going stale. Strategy: He switched to CoinGecko’s market_chart endpoint, fetching GBP and USD in parallel once an hour. Execution: He cached the response, plotted 168 hourly points, and added a “Source: CoinGecko, updated hourly” line. Results: The stale-price complaints stopped, and readers started sharing the chart because it was always current. Lesson: A live API does not just save time — it removes an entire class of error. Hand-copied numbers are wrong the moment the market moves.
Case study 2 — the UK tax spreadsheet. Problem: A freelancer in Manchester needed the GBP value of her Bitcoin on the day she received each payment, for her tax return. Strategy: She used CoinGecko’s history endpoint with the date of each payment. Execution: She recorded the date, the GBP price returned, and the source, one row per payment. Results: Her accountant accepted the figures without question, because every row named its date and its source. Lesson: For tax and accounting, a dated daily price from a named source beats a live price every time. Keep the receipt — the API response is the receipt.
Case study 3 — the trading bot that trusted one exchange. Problem: A small trading bot used only Binance prices and kept triggering on moves that did not exist on other exchanges. Strategy: Its owner added a CoinGecko aggregated price as a second check. Execution: The bot only traded when both sources agreed on the direction of the move. Results: False signals fell sharply, and the bot stopped buying brief wicks that existed on one exchange only. Lesson: One exchange’s price is a fact about that exchange, not about the market. For decisions involving money, two sources are the minimum. Our corporate treasury analysis shows how large buyers think the same way — no single price, no single venue.
Case study 4 — the student who charted the crash. Problem: A student wanted to show how Bitcoin behaved in the week it fell from above $81,000 to below $76,000. Strategy: She pulled 7 days of hourly data from the Binance klines endpoint and plotted the hourly closes. Execution: She marked the day the price broke below $76,000 and added the 7-day high and low as reference lines. Results: Her chart showed the fall was a steady slide over several days, not a single crash — a far more accurate story than the headlines suggested. Lesson: Hourly history beats daily headlines. The shape of a move matters as much as its size.
Tools for Bitcoin Price Data
1. CoinGecko API. Pros: easiest 7-day history, GBP and USD in one call pattern, huge coin coverage. Cons: Demo plan caches for 1–5 minutes, rate limits are modest. Pricing: Demo free (10,000 calls/month); paid from $35/month. Best for: charts, widgets, and research.
2. Binance public API. Pros: no key, fast candles, deepest liquidity. Cons: exchange-specific prices, not an average. Pricing: free for public market data. Best for: traders and bots.
3. Coinbase Exchange API. Pros: direct BTC-GBP candles, regulated US exchange, no key for public data. Cons: fewer pairs than Binance. Pricing: free for public market data. Best for: UK audiences and GBP charts.
4. Kraken public API. Pros: reliable OHLC data, strong reputation, BTC/GBP pair available. Cons: rate limits are stricter than Binance. Pricing: free for public data. Best for: a second source to cross-check.
5. CryptoCompare API. Pros: hourly and daily history in any currency, including GBP, with a free key. Cons: free tier is limited for heavy use. Pricing: free tier, then paid plans. Best for: hourly history in GBP.
6. CoinPaprika API. Pros: simple historical OHLCV, no key for basic use. Cons: smaller team, less documentation than CoinGecko. Pricing: free tier. Best for: quick research scripts.
7. CoinCap API. Pros: clean asset history endpoint, easy to use. Cons: USD-native, so GBP needs conversion. Pricing: free tier. Best for: simple USD apps.
8. Blockchair API. Pros: on-chain data — transactions, addresses, and blocks — to pair with price data. Cons: it is not a price API; use it alongside CoinGecko, not instead of it. Pricing: free tier about 1,000 calls/day; pay-as-you-go $1 per 1,000 calls. Best for: combining price moves with on-chain activity. See our Blockchair API guide for the full breakdown.
9. TradingView widgets. Pros: professional charts with no code, embeddable in minutes. Cons: limited customisation on the free tier, TradingView branding. Pricing: free widgets, paid plans for more features. Best for: a chart on a blog when you do not want to write code.
10. Google Sheets with an API import. Pros: no server needed, a chart in a spreadsheet anyone can copy. Cons: slow refresh, fragile if the API changes. Pricing: free. Best for: a personal tracker or a newsletter table.
Common Mistakes With Price History APIs
Mistake 1: Mixing currencies without saying so. A chart labelled “£” that was built from USD prices and a week-old exchange rate is wrong by the size of the currency move. Ask for GBP from the API, or fetch a live rate every time.
Mistake 2: Confusing hourly points with daily closes. CoinGecko’s market_chart for 7 days returns hourly points. The last point of the day is the daily close only if you take it at midnight UTC — say which one you used.
Mistake 3: Polling every second on a free tier. A 7-day chart does not change every second. Poll hourly, cache the result, and your free allowance will last all month.
Mistake 4: Trusting one source for money decisions. Exchanges disagree by a few dollars, and an API can return stale data during an outage. Cross-check a large trade against a second source before you act.
Mistake 5: Copying prices from an article. Prices move. An article’s 7-day table is a snapshot from the day it was written. Your chart should fetch live data — that is the whole point of using an API. Our blockchain engineer guide makes the same point about code: build the pipeline once, and let the data flow.
Frequently Asked Questions
What is the best free Bitcoin price history API?
CoinGecko’s Demo API is the best free starting point: the market_chart endpoint returns 7 days of hourly prices in GBP or USD with no key and 10,000 calls a month. Binance’s public klines endpoint is the best free option for traders who want candlesticks.
How do I get 7 days of Bitcoin prices in GBP?
Call CoinGecko’s /coins/bitcoin/market_chart with vs_currency=gbp and days=7, or use Coinbase’s BTC-GBP candles endpoint. Both return the history in pounds directly, with no conversion step.
How do I get 7 days of Bitcoin prices in USD?
Use the same CoinGecko endpoint with vs_currency=usd, or Binance’s klines endpoint with the BTCUSDT pair and interval=1h for 168 hourly candles.
Does the CoinGecko API need a key for price history?
No, not on the Demo plan. You can call the public endpoints without a key, up to 10,000 calls a month. A key and a paid plan raise the limits and the update speed.
What is the difference between market_chart and history in CoinGecko?
Market_chart returns a series of prices over a range (hourly for 7 days). History returns the price, market cap, and volume for one specific date. Use market_chart for charts and history for dated records such as tax returns.
Can I get Bitcoin prices in GBP and USD in one call?
Yes, with the simple price endpoint: /simple/price?ids=bitcoin&vs_currencies=gbp,usd returns the current price in both currencies at once. For history, make one call per currency.
Why do different APIs show different Bitcoin prices?
Each source samples different exchanges at different times. An aggregated API averages many exchanges; an exchange API shows one venue’s price. Small differences of a few dollars are normal — name your source and use it consistently.
How often should I update a 7-day price chart?
Hourly is enough for a 7-day chart. Updating every few minutes adds nothing visible and burns your free allowance. Update the current-price line more often only if your users trade on it.
Can I use a Bitcoin price history API in Google Sheets?
Yes. Use the IMPORTDATA or Apps Script UrlFetchApp functions to call a free endpoint such as CoinGecko’s simple price or market_chart, then chart the returned data. Cache the result so the sheet does not call the API on every recalculation.
Is Bitcoin price history data free for commercial use?
Free tiers usually allow personal and small commercial use, but check each provider’s terms: CoinGecko’s Demo plan, for example, is for personal and research use, and heavy or commercial use needs a paid plan. Always read the terms before you ship.
Conclusion
Seven days of Bitcoin prices in GBP and USD is a one-hour job once you pick the right endpoint — and a job that keeps paying, because the chart updates itself from then on. Start with CoinGecko’s market_chart for a general audience, or Binance klines if you trade, or Coinbase candles if your readers think in pounds. Ask for the currency in the request, cache the answer, name the source on the chart, and cross-check anything that involves real money against a second source.
The week to 8 November 2026 is a good reminder of why the live feed matters: Bitcoin slid from above $81,000 to near $75,900 in seven days, a move no copied-and-pasted table would have kept up with. Build the pipeline once, and you will never hand-copy a price again. What will you build with your first 7 days of data — a chart, a widget, or a trading check?