

Sara opened her trading app on the morning of 9 November 2026 and stared at the number. Bitcoin was trading near $74,938, down from an open of $75,916, and it had touched $73,510 earlier in the session. Just five days earlier it had traded above $80,000. She had one question, and it was the same question millions of holders ask after every sharp move: how did we get here? The answer is not in today’s candle. It is in the full bitcoin price history 2025 2026 — two years of rallies, crashes, ETF flows, Fed decisions, an election, a major exchange hack, and a November slide that took Bitcoin to a two-month low. This guide walks that whole timeline, leg by leg, so you can see what drove each move instead of guessing from one red day.
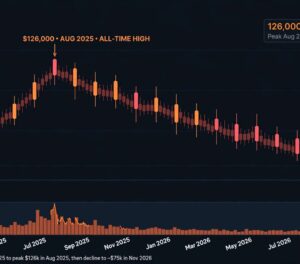
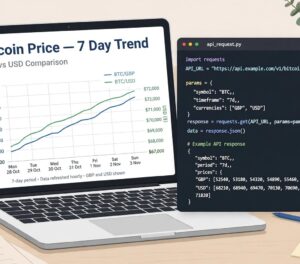
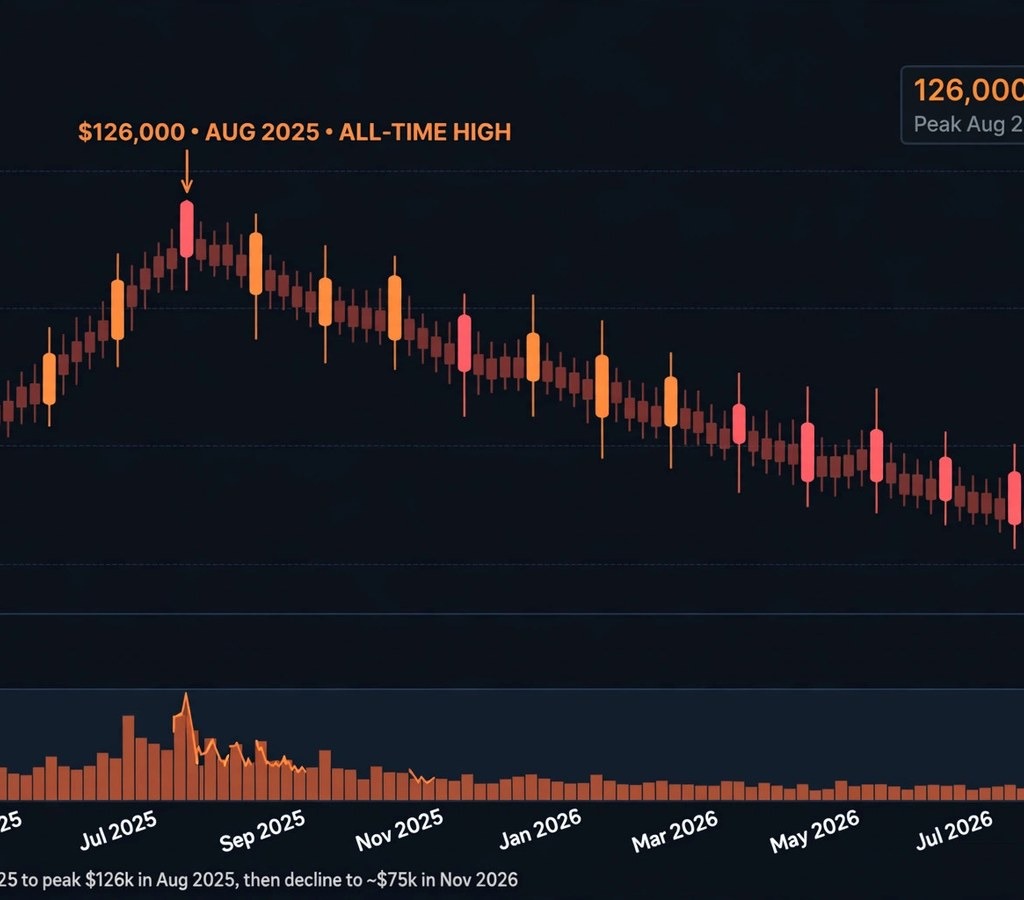
The bitcoin price history 2025 2026 matters because Bitcoin never moves for one reason. In 2025 it climbed toward a record high above $126,000. In 2026 it gave back a large part of that gain, fell through $80,000, reclaimed it for a day, then lost it again. Each leg had a trigger you can name: ETF inflows and outflows, interest-rate decisions, a midterm election, and the Binance security incident in late October 2026. If you are new to reading price charts, our blockchain explorer guide shows how to check on-chain facts for yourself, and our Bitcoin price history API guide explains where the price data in articles like this one comes from.
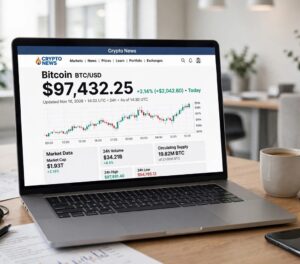
Price at time of writing — read this first: BTC was about $74,830 on Tuesday 10 November 2026 at 10:24 PKT (05:24 UTC, Finnhub, Binance BTC/USDT), with the day so far ranging $73,750 to $75,568 and a change of about +0.3% against the previous close; Monday 9 November closed at $74,900 after a $73,510 low. The US CPI report lands on Tuesday evening at 18:30 PKT and prices move fast around it, so check a live feed for the current figure. Nothing in this article is a price prediction.
Executive Summary
- Bitcoin peaked above $126,000 in 2025, then fell about 40% from that high by November 2026. The slide was not one crash. It was a series of legs, each with its own trigger.
- October 2026 was Bitcoin’s weakest October since 2014. Demand went negative, according to CryptoQuant, and the month closed in the red.
- The US midterm election produced a one-day reclaim of $80,000. Bitcoin jumped above $80,000 after the vote, then fell back below $75,600 within two days.
- The Binance hack in late October 2026 shook confidence. The estimated impact was about $6.3 billion, with about $3 billion frozen, and withdrawals reopened in phases.
- On 9 November 2026 Bitcoin broke below $75,000 intraday to $73,510, a two-month low. The $75,000 level that held for days is now the line traders watch most.
- Tools such as CoinGecko, CoinMarketCap, TradingView, Glassnode and CryptoQuant let any reader check every level in this timeline against real data instead of taking our word for it.
What the Bitcoin Price History 2025 2026 Actually Shows
A price history is not a list of numbers. It is a record of what investors believed at each moment. When you read the bitcoin price history 2025 2026 that way, three phases stand out. First, a strong 2025 climb to a record high. Second, a long 2026 grind lower, with sharp drops in October. Third, a volatile November, where one election rally and one exchange crisis collided within days of each other.
The numbers frame the story. Bitcoin’s all-time high sits near $126,080. By 9 November 2026 the price was about 40% below that peak. Over the past month it had fallen about 8%, and over the past year about 27%. Year to date it was down about 14.5%. Those are not the numbers of a market in a straight line. They are the numbers of a market that rose on real demand, then met real selling.
How to read this timeline
Every date below carries the level Bitcoin traded at and the event that moved it. Where a figure comes from a specific source, we name it. Where the market was reacting to several things at once, we say so. A single candle never tells you why a move happened. A dated timeline, checked against news, does.
2025: The Climb to a Record High
Bitcoin entered 2025 with strong momentum. Spot Bitcoin ETFs, launched in the United States in early 2024, had turned Bitcoin into a product that pension funds, advisers and ordinary brokerage accounts could buy without touching an exchange. That access changed who could own Bitcoin, and it changed how fast money could flow in — and out.
Through 2025 the price pushed higher in steps. Each new high brought fresh buyers, and each pullback found buyers who had missed the last leg. The rally was not smooth. There were sharp drops of 10% or more along the way, the kind that shake out short-term traders. But the trend held, and Bitcoin eventually traded above $126,000 — its highest price ever.
What drove the 2025 high? Three forces lined up. First, ETF inflows stayed strong for long stretches, which meant steady buying that did not depend on crypto-native traders. Second, the Federal Reserve’s rate path and a weaker dollar made scarce assets more attractive. Third, corporate buyers kept adding Bitcoin to their balance sheets, which removed coins from the open market. None of these forces works alone. Together, they pushed Bitcoin to its record.
Why the high did not hold
Record highs feel permanent while you are in them. They are not. At prices above $120,000, every holder sat on a large profit, and any bad news gave them a reason to sell. The market also grew crowded: leverage built up, and leveraged positions turn small drops into forced selling. That setup matters for everything that followed in 2026, because the same leverage that pushed Bitcoin up also pushed it down faster when the mood changed.
Early to Mid 2026: The Long Slide Begins
Bitcoin started 2026 by giving back gains. The slide was slow at first — a few percent here, a recovery there — and that slowness fooled many holders. A market that falls 2% a week does not feel like a crash. But week after week, it adds up. By the middle of the year, Bitcoin had lost a large share of its 2025 gain, and the mood had shifted from excitement to patience.
Several things weighed on the price in this phase. ETF flows turned mixed, with outflow days outnumbering inflow days for stretches. Tech stocks wobbled, and Bitcoin still trades like a risk asset when stocks fall — it drops with them, even though its long-term story is different. And the Federal Reserve kept rates higher for longer than many investors had hoped, which kept the dollar firm and made holding non-yielding assets less attractive.
The lesson of this phase is simple, and it repeats in every cycle. Bitcoin’s biggest drops rarely start with one dramatic event. They start with demand drying up. Buyers step back, sellers keep selling, and the price drifts lower until something forces a decision.
October 2026: Red October and the Binance Hack
October 2026 was the month the slide turned into a rout. It ended as Bitcoin’s weakest October since 2014 — a striking fact, because October is usually one of Bitcoin’s strongest months. CryptoQuant reported that Bitcoin demand had gone negative during the month. In plain terms, more Bitcoin was being sold than bought, and the price reflected it.
Our full account of that month is in Red October: Bitcoin’s Weakest October Since 2014. The short version is that October combined three pressures at once: ETF outflows, a hawkish Federal Reserve, and a loss of confidence after a major security incident.
The Binance security incident
Late in October 2026, Binance — the world’s largest crypto exchange — suffered a major security incident. The estimated impact was about $6.3 billion, with about $3 billion frozen. The preliminary cause was a compromised DevOps laptop. Withdrawals were paused and then reopened in phases, network by network.
The market reaction was fast. Bitcoin fell below $79,000 as the news spread, and about $4.65 billion left Binance on 1 November against about $1.01 billion deposited — a net outflow of about $3.64 billion in a single day. Fiat withdrawals later reopened. Binance said about 95% of affected assets had been replenished by early November, rising to about 98% in its Recovery Update #7, and it took a new proof-of-reserves snapshot covering 44 tokens on 4 November. The full zero-knowledge proof for that snapshot was still pending at the time of writing. Our detailed coverage is in Binance Proof of Reserves: The Zero-Knowledge Proof Is Complete, which explains what the earlier proof showed — and what it did not.
The Binance incident matters to the bitcoin price history 2025 2026 for a reason beyond the price drop. It tested whether the market could tell the difference between one exchange’s problem and Bitcoin’s own security. Bitcoin’s network never stopped. But traders sold first and asked questions later, which is what markets do in a crisis.
The Fed’s hawkish hold
On 28 October 2026 the Federal Reserve held interest rates steady but sounded hawkish — meaning it signalled no rush to cut rates. Bitcoin fell below $80,000 on the eve of that decision, and the hawkish tone kept pressure on the price afterwards. Our coverage, Fed Holds Rates but Turns Hawkish, explains why a “hold” can still hurt Bitcoin: when rates stay high, holding cash pays well, and holding Bitcoin pays nothing. For a full view of the month, see also Downtober: CryptoQuant Says Bitcoin Demand Went Negative.
November 2026: The Election Rally That Lasted a Day
November opened with the US midterm elections on 3 November 2026. The history of midterms and Bitcoin is striking: after the previous three midterms, Bitcoin averaged a gain of about 53.7% over the following twelve months — though the sample is only three elections, so that average proves little on its own. Our history piece, Bitcoin After the US Midterms, covers that record in full.
This time, the first reaction looked familiar. On election night Bitcoin dipped to about $75,740, then recovered and pushed above $80,000, trading near $80,500 on 5 November — a gain of about 3.9% in a day. About $950 million to $1 billion of leveraged positions were liquidated in 24 hours, with more than $560 million of those being short positions. Short sellers who had bet on a fall were forced to buy back, which pushed the price up further.
Then the rally ended almost as fast as it began. On 5 November Bitcoin fell from $80,882 overnight to $75,573 in the afternoon. The overnight low on 5–6 November was $75,208 — below the election-night low of $75,618. The $80,000 reclaim had lasted about a day. The cause, according to market reports, was a sharp fall in US tech stocks: the Nasdaq dropped 5.52%, and Bitcoin fell with it.
Ethereum told the same story, only worse. ETH fell to about $2,216, down about 8.5%, after six straight days of ETF outflows in late October and early November. Our November outlook, Bitcoin in November: Does $76K Hold, or Is $73K Next?, framed the question that still defines the market: does $76,000 hold as support, or is $73,000 next?
9 November 2026: Below $75,000 and a Two-Month Low
That question got a partial answer on the morning of Monday 9 November 2026. After a quiet weekend, crypto prices fell sharply in early Monday trading. Bitcoin briefly dropped to $73,510 before recovering above $75,000, then settled near $74,938 at the time of writing. It was the lowest price since August, and the second time in four days that Bitcoin had tested the $75,000 area and slipped through it.
Ether fell about 5% to a low near $2,060 before recovering to about $2,127. The reported trigger was tougher US crypto rules looming after the midterm result: with Democrats projected to control both chambers, the industry-backed CLARITY Act — which had already stalled in the Senate in September — faces a harder path, and traders sold on that uncertainty.
Two levels now matter most. The first is $75,000 itself: the level Bitcoin defended for days, then lost. The second is the $73,500–$74,000 zone, the morning’s low, which traders will watch as the next line of defence. Above, $75,590 is the first resistance. The 14-day relative strength index sat near 36.7, which signals heavy selling pressure without yet calling a bottom. The 20-day moving average near $79,031 and the 50-day near $81,770 both sit well above the current price — a reminder of how far the market has fallen from its recent range.
None of this makes the old support levels irrelevant. The 50-week moving average near $75,556 and Strategy’s reported cost basis near $75,451 both sit just above the current price, which is why the $75,000 area drew so much attention. But a level that has been tested and broken is not the same as a level that held. Tuesday’s US CPI report — due at 18:30 PKT — is the next event that could move it either way.
The Full Timeline at a Glance
| Date | Bitcoin price | What happened |
|---|---|---|
| 2025 | Rose above $126,000 | Record high on strong ETF inflows, corporate buying and a weak-dollar backdrop. |
| Early–mid 2026 | Long grind lower | ETF flows turned mixed, tech stocks wobbled, rates stayed high. |
| October 2026 | Weakest October since 2014 | CryptoQuant demand went negative; Fed held rates with a hawkish tone on 28 October. |
| Late October 2026 | Below $79,000 | Binance security incident: about $6.3B impact, about $3B frozen, withdrawals paused. |
| 1 November 2026 | Net outflow day | About $4.65B left Binance vs about $1.01B deposited; fiat withdrawals later reopened. |
| 3 November 2026 | Dip to about $75,740 | US midterm elections; Democrats projected to take both chambers. |
| 5 November 2026 | Above $80,000, then $75,573 | Election rally, $950M–$1B liquidations, then a crash as the Nasdaq fell 5.52%. |
| 5–6 November 2026 | Low $75,208 | Below the election-night low of $75,618; ETH near $2,216. |
| 9 November 2026 | Low $73,510, near $74,938 | Two-month low; ETH low near $2,060; tougher US crypto rules feared after midterms. |
| 10 November 2026 | To be decided | US CPI for October due at 18:30 PKT — the next big test for the $75,000 level. |
What Drove Each Leg: The Five Forces Behind the Bitcoin Price History 2025 2026
1. ETF flows: the new marginal buyer — and seller
Spot Bitcoin ETFs changed the market in a simple way: they made Bitcoin easy to buy and easy to sell for people who never touch an exchange. When inflows run strong, they add steady buying pressure. When outflows run for days — as they did for Ethereum in late October, with six straight outflow days totalling about $1.61 billion in October — they add steady selling. The bitcoin price history 2025 2026 tracks ETF flows closely, because ETFs are now the largest single source of new demand.
2. Interest rates and the dollar
Bitcoin pays no interest. When the Federal Reserve keeps rates high, holding cash pays well, and Bitcoin must offer something else — growth — to compete. The Fed’s hawkish hold on 28 October 2026 is the clearest example in this timeline: rates did not change, but the message did, and Bitcoin fell. Tuesday’s CPI report matters for the same reason. A hot CPI reading pushes rate cuts further away. A cool one brings them closer.
3. Politics: elections and regulation
The midterm election moved Bitcoin twice in three days — down on election night, up the next day, then down again. That whiplash shows how politics moves crypto: not through one law, but through expectations about future laws. The CLARITY Act, which would set federal rules for crypto markets, stalled in the Senate in September. After the midterm result, traders priced in a harder path for it, and Bitcoin fell to a two-month low on 9 November. Regulation is slow. Market reactions to it are fast.
4. Exchange trust: the Binance lesson
Bitcoin’s network did not fail in October 2026. One large exchange did. Yet Bitcoin’s price fell anyway, because most holders keep coins on exchanges and most trading happens there. Trust in exchanges is part of Bitcoin’s price, whether holders like it or not. The recovery — phased withdrawals, 98% of assets replenished, a new 44-token proof-of-reserves snapshot — helped stabilise the market. But the proof for that snapshot was still pending in early November, and until it lands, a question mark remains.
5. Leverage: the accelerator in both directions
Leverage explains why Bitcoin’s moves feel so violent. On 5 November, more than $560 million of short positions were liquidated in a day, which forced buying and pushed the price above $80,000. Hours later, long positions were liquidated on the way down. Liquidations do not start a move. They finish it, faster and harder than the news alone would. Any reader of the bitcoin price history 2025 2026 who ignores leverage will keep being surprised by the speed of Bitcoin’s moves.
Case Studies: Five Moments That Explain the Price
Case study 1: The record high — buying the top of 2025
Problem: A buyer who entered near $126,000 watched the price fall 40% over the following year. Strategy: Instead of selling at a loss, they set a rule: no new buys above the 50-week moving average, and small buys only when the price fell 10% below it. Execution: They bought in tranches through 2026, never more than a fixed amount per month. Results: Their average cost fell well below $100,000, though the position stayed underwater into November. Lesson: A record high is a bad entry point for a lump sum, but a plan beats panic. The buyers who survived 2026 were the ones with rules written before the fall.
Case study 2: Red October — the month demand went negative
Problem: In October 2026, CryptoQuant data showed Bitcoin demand turning negative while the price slid. Strategy: Traders who watched demand, not just price, cut exposure early in the month instead of waiting for a bounce. Execution: They moved part of their holdings to stablecoins and set alerts at $80,000 and $76,000. Results: They avoided the worst of the October slide and kept cash ready for the November dip. Lesson: Demand data leads price. When buyers disappear, the price follows — usually within days, not weeks.
Case study 3: The Binance hack — selling the news, then the recovery
Problem: Holders with funds on Binance faced paused withdrawals and falling prices in late October. Strategy: Those who had already moved most holdings to self-custody watched the news calmly; those who had not, rushed to withdraw when withdrawals reopened. Execution: Binance reopened withdrawals in phases across networks, and about $4.65 billion left on 1 November alone. Results: The exchange replenished about 98% of affected assets, and the market stabilised — but the episode cost holders who sold at the bottom. Lesson: Self-custody is not a slogan. It is the difference between watching a crisis and living through one. Our blockchain wallet guide explains the options.
Case study 4: The one-day $80,000 reclaim
Problem: After the midterms, Bitcoin jumped above $80,000 and many traders chased the move. Strategy: The disciplined traders treated $80,000 as a level to test, not a signal to buy at any price. Execution: They waited for a daily close above $80,000 before adding exposure — a close that never came. Results: They avoided buying the top of a one-day rally, and the price fell to $75,573 the same day. Lesson: A level that holds for hours is not support. Support is proven by time, and one day is not enough.
Case study 5: The 9 November dip below $75,000
Problem: On Monday 9 November, Bitcoin broke below $75,000 to $73,510, a two-month low, on fears of tougher US crypto rules. Strategy: Traders who had marked $73,500–$74,000 as the next support zone watched it instead of the headline price. Execution: The price bounced from $73,510 back above $75,000 within the session, which told them buyers still existed at that zone — for now. Results: The bounce held into the morning, but the level remains unproven until it survives a daily close and the CPI report. Lesson: Intraday lows are information, not verdicts. The verdict comes when the market closes, and again when the next big data point lands.
Tools to Track Bitcoin Price History Yourself
You do not need to trust this article’s numbers. Every level above can be checked in minutes with the tools below. We use them to verify our own articles, including the Bitcoin price history API guide published as part of Day D. Start with the raw data: CoinGecko’s Bitcoin page and CoinMarketCap’s Bitcoin page both publish free historical prices, and the BLS release schedule confirms the CPI date used in this article.

| Tool | What it is best for | Pros | Cons | Pricing |
|---|---|---|---|---|
| CoinGecko | Historical prices, market cap, volume | Free historical charts; huge coin coverage | Aggregated price can differ slightly from exchanges | Free; Pro from about $8/month |
| CoinMarketCap | Historical data tables and rankings | Detailed historical data pages; widely cited | Ads on free tier; some data behind login | Free; Pro from about $29/month |
| TradingView | Charting and technical levels | Best charting tools; moving averages, RSI, alerts | Steep learning curve for beginners | Free; Pro from about $15/month |
| Glassnode | On-chain data and holder behaviour | Real on-chain metrics; long history | Most useful data is paid | Free tier; Standard from about $39/month |
| CryptoQuant | Demand, flows and exchange data | Source of the “demand went negative” call | Interpretation needs experience | Free tier; Pro from about $39/month |
| CoinDesk Indices | Benchmark price index (XBX) | Transparent index method; institutional standard | Less charting than TradingView | Free to view |
| Binance | Live price and trading volume | Deepest liquidity; real order-book data | Exchange price is one venue, not the market | Free to view; trading fees apply |
| Coinbase | US exchange price and charts | Clean interface; trusted US venue | Higher fees on simple buys | Free to view; trading fees apply |
| Kraken | Exchange price and history | Long track record; good charting | Smaller volume than Binance | Free to view; trading fees apply |
| Yahoo Finance | Quick price checks and news | Free; combines price with market news | Less crypto-specific data | Free |
| Investing.com | Price, news and economic calendar | Good CPI and Fed calendar; free alerts | Ads; some features need an account | Free; Pro from about $15/month |
| Messari | Research and asset profiles | Strong research; clean asset data | Best research is paid | Free tier; Pro from about $25/month |
Common Mistakes When Reading Bitcoin Price History
Mistake 1: Treating one price as “the” price
Bitcoin trades on hundreds of venues. The price on Binance, Coinbase and CoinGecko differ by small amounts at any moment. On 9 November, for example, different sources showed $74,938, $74,989 and $75,122 within the same hour. That is normal. Always note the source and the time, and never argue over a $100 difference.
Mistake 2: Reading a chart without the news
A chart shows what happened. It never shows why. The drop on 5 November looks like a random crash until you know the Nasdaq fell 5.52% that day. The dip on 9 November looks random until you know traders feared tougher US crypto rules. Always pair a chart with a calendar: Fed meetings, CPI releases, elections and exchange news.
Mistake 3: Calling every bounce a bottom
Bitcoin bounced from $73,510 back above $75,000 on 9 November. That bounce is encouraging, but it is not a bottom until the price holds above $75,000 for days and survives the CPI report. Bottoms are confirmed in hindsight. Anyone who calls one in real time is guessing.
Mistake 4: Forgetting that history rhymes, not repeats
After the last three midterms, Bitcoin averaged about 53.7% over twelve months. That does not mean it will do so again. Three elections is a tiny sample, and this Congress faces a different regulatory fight. Use history as context, not as a forecast.
What Comes Next for Bitcoin

The next data point is the US CPI report on Tuesday 10 November at 18:30 PKT. A cooler-than-expected reading would support the case for rate cuts, which usually helps Bitcoin. A hotter reading would push cuts further away and test the $73,500 zone again. Beyond CPI, the calendar holds the Binance withdrawal target of 13 November — when HYPE, INJ, APT, PLASMA, NEAR and LTC withdrawals are due to reopen — and the still-pending 44-token proof-of-reserves proof, which the market will read as a trust signal either way.
Longer term, the forces that drove the bitcoin price history 2025 2026 have not gone away. ETF flows still decide the marginal buyer. The Fed still decides the cost of holding cash instead of Bitcoin. Regulation still decides how easily new buyers can enter. And leverage still decides how fast moves happen. The price will keep moving on those four forces long after November’s headlines fade.
For readers who want to follow the story as it happens, our November outlook frames the $76,000-versus-$73,000 question, our detailed blockchain technology guide explains the network underneath the price, and our simple blockchain guide is the place to start if any of this felt technical. If you trade on an exchange, our crypto exchange guide covers how to choose a platform and what fees to expect.
Frequently Asked Questions
What was Bitcoin’s highest price in 2025?
Bitcoin traded above $126,000 in 2025, with an all-time high near $126,080. By 9 November 2026 it was about 40% below that peak.
Why did Bitcoin fall in October 2026?
Three pressures combined: ETF demand went negative, the Federal Reserve held rates with a hawkish tone on 28 October, and the Binance security incident shook confidence. October ended as Bitcoin’s weakest October since 2014.
What happened to Bitcoin on 5 November 2026?
Bitcoin jumped above $80,000 after the US midterm elections, with about $950 million to $1 billion in liquidations, then fell the same day to $75,573 as US tech stocks dropped sharply. The $80,000 reclaim lasted about a day.
What is the lowest Bitcoin price in November 2026 so far?
As of the morning of 9 November 2026, the low was $73,510, reached in early Monday trading. The previous low was $75,208 on the night of 5–6 November.
Does $75,000 still matter as a support level?
It matters as a level traders watch, but Bitcoin has now slipped below it intraday twice in four days. A level is only proven support when the price closes above it repeatedly. The $73,500–$74,000 zone is the next area to watch.
How did the Binance hack affect the Bitcoin price?
The incident, with an estimated impact of about $6.3 billion and about $3 billion frozen, pushed Bitcoin below $79,000 and triggered about $4.65 billion in net outflows from Binance on 1 November. Withdrawals reopened in phases, and about 98% of affected assets were replenished.
Where can I check Bitcoin’s price history myself?
CoinGecko and CoinMarketCap both publish free historical price charts and tables. TradingView is best for charting, while Glassnode and CryptoQuant show on-chain and demand data behind the price moves.
What is the US CPI report and why does it move Bitcoin?
The Consumer Price Index measures inflation. When it comes in hot, the Federal Reserve is less likely to cut rates, which usually hurts Bitcoin. The October CPI is due on Tuesday 10 November at 18:30 PKT.
Is Bitcoin in a bear market now?
That depends on the definition. Bitcoin is about 40% below its all-time high, which meets some definitions of a bear market, but it is still far above its 2025 lows and its long-term trend. Galaxy argued the bear market ended in June 2026; the November price action shows the debate is not settled. Read the arguments, not just the label.
What should I watch next after reading this history?
Watch three things: the CPI report on 10 November, whether Bitcoin holds above $73,500 on a daily close, and the Binance 44-token proof-of-reserves proof. Together they will say more about the next leg than any single price level.
Conclusion
The bitcoin price history 2025 2026 is a story of a market that climbed to a record high on real demand, then gave back 40% of it through a slow grind, a red October, an exchange crisis, and a one-day election rally that ended in a crash. Each leg had a cause you can name, and each cause is still in play: ETF flows, interest rates, politics, exchange trust and leverage. The latest chapter — the dip to $73,510 on 9 November — does not rewrite that story. It continues it, and it leaves the $75,000 question open for Tuesday’s CPI report to answer.
The practical lesson is the same one every part of this history teaches. Do not trade the headline. Trade the plan: know your levels, know your sources, and check the data yourself before you act. The tools in this guide make that possible for any reader, and the timeline above gives you the context to use them well. If you have followed Bitcoin through 2025 and 2026, which force do you think will decide its next big move — the Fed, the ETFs, or regulation?